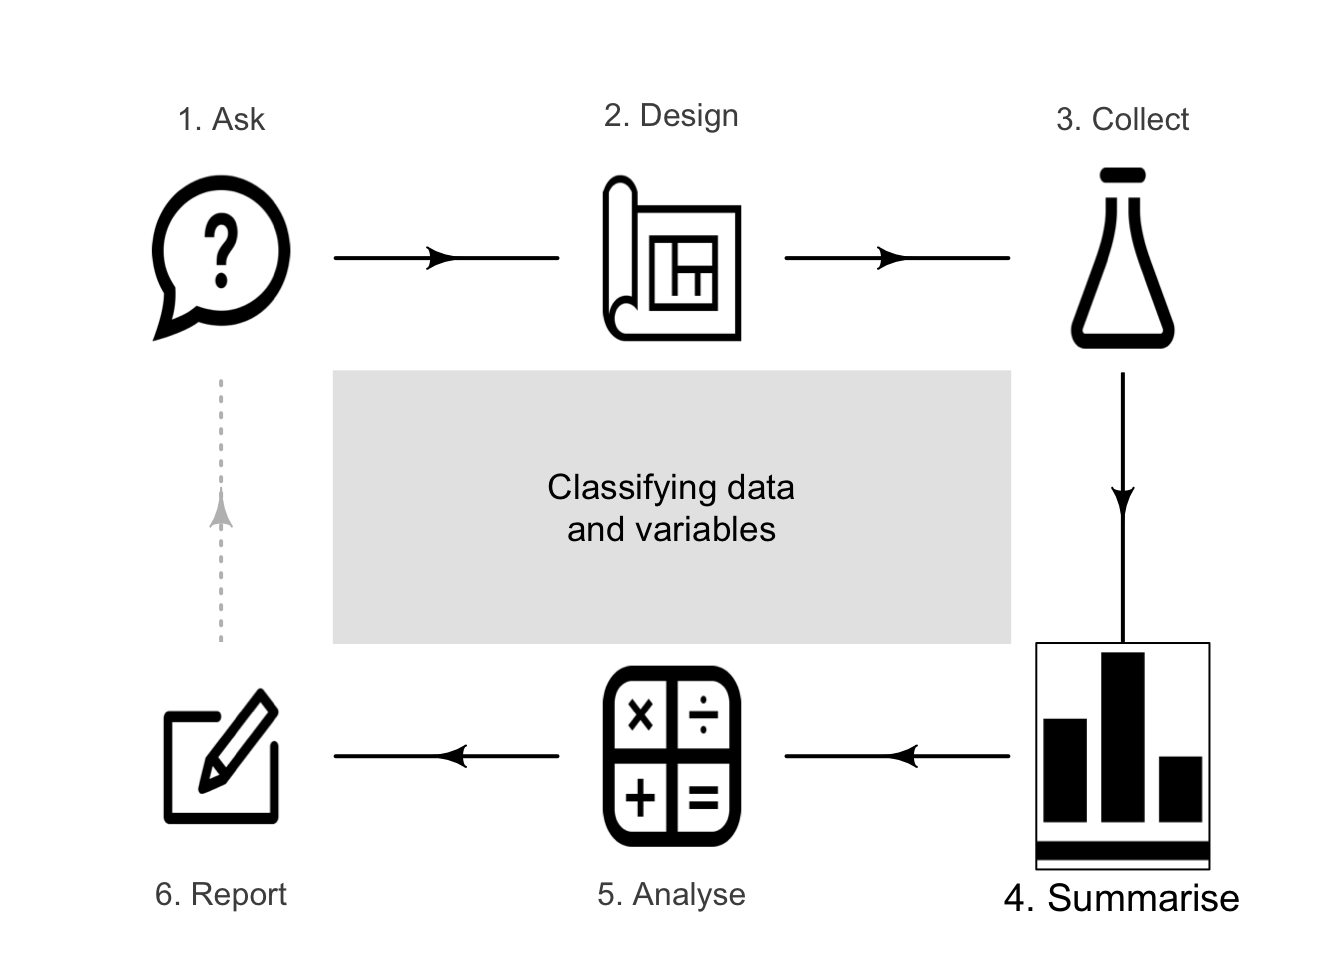
10 Classifying data and variables
So far, you have learnt to ask a RQ, design a study, and collect the data. In this chapter, you will learn how to classify the data, because this determines the analysis. You will learn to:
- identify and distinguish qualitative and quantitative variables.
- identify and distinguish nominal and ordinal qualitative variables.
- identify and distinguish continuous and discrete quantitative variables.
10.1 Introduction
Understanding the type of data collected is essential before summarising or analysing, because the type of data determines how to proceed. Broadly, data may be classified as either quantitative data (Sect. 10.2) or qualitative data (Sect. 10.3). The data are the recorded values of the variables, so we also talk about quantitative and qualitative variables. Quantitative variables record quantitative data; qualitative variables record qualitative data.
Example 10.1 (Variables and data) 'Age' is a variable because age varies from individual to individual (Def. 2.9). The data may include values like \(13\) months, \(21\) years and \(76\) years.
10.2 Quantitative data: discrete and continuous data
Quantitative data are mathematically numerical. Most data arising from counting or measuring are quantitative. Quantitative data often (but not always) have measurement units (such as kg or cm). Be careful: numerical data are not necessarily quantitative; only mathematically numerical data are quantitative (numbers with numerical meanings).
Definition 10.1 (Quantitative data) Quantitative data are mathematically numerical: the numbers have numerical meaning, and represent quantities or amounts. Quantitative data generally arise from counting or measuring.
Example 10.2 (Quantitative data) The weight of numbats, the thickness of sheet metal, and blood pressure are all measured, and are quantitative variables.
The number of power failures per year, the number of solar panels per home, and the number of tangelos per tree are all counts, and are quantitative variables.

Australian postcodes are four-digit numbers, but are not quantitative; the numbers are labels. A postcode of 4556 isn't one 'better' or 'more' than a postcode of 4555. The values do not have numerical meanings. Indeed, alphabetic postcodes could have been chosen. For example, the postcode of Caboolture (Queensland) is 4510, but could have been QCAB.
Quantitative data may be further classified as discrete or continuous. Discrete quantitative data have possible values that can be counted, at least in theory. Sometimes, the possible values may have no theoretical upper limit, yet are still considered 'countable'. Continuous quantitative data have values that cannot, at least in theory, be recorded exactly: another value can always be found between any two given values of the variable, if we measure to a greater number of decimal places. In practice, though, values must be rounded to a reasonable number of decimal places.
Definition 10.2 (Discrete data) Discrete quantitative data has a countable number of possible values between any two given values of the variable.
Example 10.3 (Discrete quantitative data) These quantitative variables are discrete:
- The number of people in passenger vehicles being driven on a certain road. Possible values: \(1\), \(2\), \(\dots\), with an upper limit of perhaps \(8\).
- The number of cracked eggs in a carton of \(12\). Possible values: \(0\), \(1\), \(2\), \(\dots\) \(12\).
- The number of orthotic devices a person has used. Possible values: \(0\), \(1\), \(2\), \(\dots\)
- The number of turbine cracks after \(750\) hours use. Possible values: \(0\), \(1\), \(2\), \(\dots\)
Definition 10.3 (Continuous data) Continuous quantitative data have (at least in theory) an infinite number of possible values between any two given values.
Height is continuous: between the heights of \(179\,\text{cm}\) and \(180\,\text{cm}\), many heights exist, depending on how many decimal places are used to record height. In practice, however, heights are usually rounded to the nearest centimetre for convenience. All continuous data are rounded.
Example 10.4 (Continuous quantitative data) These quantitative variables are continuous:
- The weight of \(6\)-year-old Fijian children. Values exist between any two given values of weight, by measuring to more decimal places of a kilogram. However, weights are usually reported to the nearest kilogram.
- The energy consumption of houses in London. Values exist between any two given values of energy consumption, by measuring to more and more decimal places of a kiloWatt-hour (kWh). Consumption would usually be given to the nearest kWh.
- The time spent in front of a computer each day for employees in a given industry. Values exist between any two given times, by measuring to more decimal places of a second. The values may be reported to the nearest minute, or the nearest \(15\,\text{mins}\).
Sometimes, discrete quantitative data with a very large number of possible values may be treated as continuous.
Example 10.5 (Treating discrete data as continuous) Annual income is discrete, since no income is between $\(80\,000.00\) and $\(80\,000.01\). However, annual incomes are much larger than cents, and vary at scales much greater than cents, and so are usually treated as continuous.
10.3 Qualitative data: nominal and ordinal data
Qualitative data has distinct labels or categories, and are not mathematically numerical. Be careful: numerical data may be qualitative if those numbers don't have numerical meanings. The categories of a qualitative variable are called the levels or the values of the variable.

Definition 10.4 (Qualitative data) Qualitative data are not mathematically numerical data: they comprise mutually exclusive, exhaustive categories or labels.
Definition 10.5 (Levels) The levels (or the values) of a qualitative variable refer to the names of the distinct categories.
Example 10.6 (Qualitative data) 'Brand of mobile phone' is a variable (as 'brand' varies from phone to phone) that is qualitative. Many levels (i.e., brands) are possible, but could be simplified by using the levels as 'Apple', 'Samsung', 'Google' and 'Other'.
Example 10.7 (Qualitative data) Social Security Numbers (ssn) in the US are nine-digit numbers unique to each individual. The first three digits represent geographic regions; the next two digits are assigned to groups in that region. The last four digits are unique to individuals.
Although the ssn is a nine-digit number, ssn is a qualitative variable.
Example 10.8 (Clarity in variables) 'Age' is a continuous quantitative variable, since age could be measured to many decimal places of a second. Age is usually rounded down to the number of completed years, for convenience. However, the age of young children may be given as '\(3\) days' or '\(10\) months'.
Sometimes Age group is used (such as Under \(20\); \(20\) to under \(50\); \(50\) or over) instead of Age. 'Age group' is qualitative.
Ensure you are clear about which is used.
Example 10.9 (Levels) The levels of a variable depend on how the variable is defined. For example, the variable 'How does the person commute to work' may have two levels: 'Using public transport' and 'Not using public transport'.
Alternatively, the variable could be written as 'Does the person use public transport to commute to work?' For this variable, the levels are 'Yes' and 'No'.
Qualitative data can be further classified as nominal or ordinal.
Definition 10.6 (Nominal qualitative variables) A nominal qualitative variable is a qualitative variable where the levels do not have a natural order.
Definition 10.7 (Ordinal qualitative variables) An ordinal qualitative variable is a qualitative variable where the levels do have a natural order.
Example 10.10 (Nominal and ordinal data) Blood type is qualitative with four levels: Type A; Type B; Type AB; Type O. These levels have no natural order; they can be ordered alphabetically, or by prevalence. Blood type is nominal.
Age group could be listed with levels Under \(20\); \(20\) to under \(50\); \(50\) or over. These levels have a natural order: youngest to oldest. Age group is ordinal.
Example 10.11 (Ordinal data) Consider this questionnaire question:
Please indicate the extent to which you agree or disagree with this statement: 'Vaping should be banned'.
Strongly disagree; Disagree; Neither agree nor disagree; Agree; Strongly agree.
The responses will be ordinal with five levels. Giving the levels in the given order (or the reverse order) makes sense; giving the levels in alphabetical order, for example, would be very confusing. The levels have a natural order.
Example 10.12 (Types of variables) Consider a study to determine if the weight of \(500\,\text{g}\) bags of pasta actually weigh \(500\,\text{g}\) (or more) on average. One approach is to record the weight of pasta in each bag (a quantitative variable), and compare the average weight to the target weight of \(500\,\text{g}\).
Another approach is to record whether each bag of pasta was underweight using a balance scale. This variable would be qualitative, with two levels (underweight; not underweight). The percentage of underweight bags could be reported.
Most statistical software requires variables to be classified as quantitative or qualitative (and perhaps discrete or continuous; ordinal or nominal). This enables the software to produce appropriate output and suggest appropriate analyses.
10.4 Example: water access
López-Serrano et al. (2022) studied three rural communities in Cameroon, and recorded information about access to water.
The study could be used to determine contributors to the incidence of diarrhoea in young children (\(85\) households had children under \(5\) years of age).
The variables in the WaterAccess dataset are classified in Tables 10.1 and 10.2.
| Qualitative variable | Type | Levels |
|---|---|---|
| Region | Nominal | Mbeng; Mbih; Ntsingbeu |
| Education | Ordinal | Primary or less; Secondary or higher |
| Distance to water source | Ordinal | Under \(100\,\text{m}\); \(100\,\text{m}\) to \(1000\,\text{m}\); over \(1000\,\text{m}\) |
| Queuing time at water source | Ordinal | Under \(5\,\text{mins}\); \(5\) to \(15\,\text{mins}\); Over \(15\,\text{mins}\) |
| Household has a garden | Nominal | Yes; No |
| Household keeps livestock | Nominal | Yes; No |
| Water source | Nominal | Well; Bore; Tap; River |
| How often water container washed | Ordinal | Before each fill; Once per week; Once per month |
| Diarrhoea in children under \(5\) | Nominal | Yes; No |
| Quantitative variable | Type | Information |
|---|---|---|
| Household coordinator's (woman's) age | Continuous | Rounded to nearest year |
| Number of people in household | Discrete | |
| Number of children under \(5\) in household | Discrete |
10.5 Chapter summary
The type of data collected determines the types of summaries and analyses that are needed. Data and variables can be classified as either:
- quantitative (discrete or continuous) if mathematically numerical; or
- qualitative (nominal or ordinal) if not mathematically numerical.
10.6 Quick revision questions
Benetou et al. (2020) studied school-aged adolescents in Greece. Among other variables, for each child they recorded the body-mass index (weight, divided by height-squared), diet quality (poor; moderate; good), the region where they lived (Attica; Thessaloniki; Other), the number of days they performed physical exercise in the last week, and school grade.
Are the following statements true or false?
- 'Body-mass index' is a quantitative discrete variable.
- 'Diet quality' is a qualitative ordinal variable.
- 'Region of residence' is a qualitative nominal variable.
- 'Number of days the child performed physical exercise in the last week' is a quantitative discrete variable.
- 'School grade' is a quantitative discrete variable.
10.7 Exercises
Answers to odd-numbered exercises are given at the end of the book.
Exercise 10.1 Classify these variables as quantitative (discrete or continuous) or qualitative (nominal or ordinal).
- The knee-flex angle after treatment.
- Whether laser drilling of small holes in concrete is successful.
- Length of time between arrival at an emergency department, and admission.
- Telephone numbers.
Exercise 10.2 Classify these variables as quantitative (discrete or continuous) or qualitative (nominal or ordinal).
- Number of eggs laid by female brush turkeys.
- Whether a child eats the recommended serving of fruit each day.
- Bar code numbers on supermarket products.
- The breed of dog used for koala detection.
Exercise 10.3 True or false: these variables qualitative and nominal.
- The age group of respondents to a survey.
- Whether a cyclist is wearing a helmet or not.
- The dosage of a medication applied: \(40\), \(60\) or \(80\,\text{mg}\) per day.
Exercise 10.4 True or false: these variables qualitative and ordinal.
- The brand of fertilizer being applied.
- The age of trees.
- Highest level of education (never finished school; primary school; secondary school; beyond secondary school).
Exercise 10.5 A study recorded whether people (who were not swimming) were wearing head-protection at the beach. The results were recorded as None; Cap; or Hat. Which of the following words could be used to classify this variable:
- Nominal
- Qualitative
- Continuous
- Quantitative
- Ordinal
Exercise 10.6 Schepaschenko et al. (2017a) studied lime trees (Tilia cordata), and recorded these variables for \(385\) trees in Russia: the foliage biomass (in kg); the tree diameter (in cm); the age of the tree (in years); and the origin of the tree (one of Coppice, Natural, or Planted).
Classify the variables in the study using the language of this chapter.
Exercise 10.7 A study is comparing the proportion of females and males who wear hats between \(10\)am and \(2\)pm. Which one of these could be the explanatory variable?
- The sex of the person.
- 'Female' and 'male'.
- The percentage of people who are female.
Exercise 10.8 A study is comparing the proportion of older women (aged \(40+\)) and younger women (under \(40\)) who work full-time. Which one of these could be the explanatory variable?
- 'Full-time' and 'part-time'.
- The percentage of women who are aged under \(40\).
- Whether a woman is aged under \(40\).
- 'Yes' and 'no'.
Exercise 10.9 Are these variables quantitative (discrete or continuous; what units of measurement), or qualitative (nominal or ordinal, and with what levels?)?
- Systolic blood pressure.
- Diet (vegan; vegetarian; neither vegan nor vegetarian).
- Socioeconomic status (low income; middle income; high income).
- Number of times a person visited the doctor last year.
Exercise 10.10 Alley et al. (2017) studied body-mass index and its relationship with use of social media, and recorded these variables (among others) from a group of \(1\,140\) participants:
- Age (under \(45\); \(45\) to \(64\); \(65\) or over).
- Gender (male; female).
- Location (urban; rural).
- Social media use (none; low; high).
- Total sitting time, in minutes per day.
For each variable, classify the type of variable: quantitative (discrete or continuous; what units of measurement?), or qualitative (nominal or ordinal; what levels?).
Exercise 10.11 The Behavioral Risk Factor Surveillance System (brfss; Control and (CDC) (2021--2023)) survey collects data annually in all \(50\) US states, the District of Columbia and three US territories, from more than \(400\,000\) adults each year. The following questions, among many others, appear in the 2023 brfss survey:
- Do you own or rent your home? (Options: Own, Rent; Other.)
- How many children less than \(18\) years of age live in your household?
- How many cell (mobile) phones do you have for personal use? (Options: \(1\); \(2\); \(3\); \(4\); \(5\); \(6\) or more.)
- Have you ever served on active duty in the United States Armed Forces? (Options: Yes; No.)
- About how much do you weigh without shoes?
Classify the type of data collected from each question.
Exercise 10.12 The National Health and Nutrition Examination Survey (nhanes; Control and (CDC) (2024)) survey:
... examines a nationally representative sample of about \(5\,000\) persons each year...
The following questions, among many others, appear in the 2021--2023 nhanes survey, and are asked about the person selected in the household (SP) to complete the questionnaire:
- Do you consider SP now to be overweight, underweight, or about the right weight?
- How many rooms are in SP's home? (Count the kitchen and do not count any bathrooms, or an unfinished basement, or a laundry room.)
- How many people who live in SP's home smoke cigarettes, cigars, little cigars, pipes, water pipes, hookah, or any other tobacco product?
- Has SP ever been told by a doctor or other health professional that SP had asthma? (Options: Yes; No; Don't know.)
- Overall, how would SP rate the health of SP's teeth and gums? (Options: Excellent; Very good; Good; Fair; Poor.)
Classify the type of data collected from each question.
Exercise 10.13 Swinnen et al. (2018) studied using ankle-foot orthoses in children with cerebral palsy. Table 10.3 give the data for the \(15\) subjects. (GMFCS is the Gross Motor Function Classification System) describing the impact of cerebral palsy on motor function; lower levels mean better functionality.) Classify the variables in the study using the language of this chapter.
| Gender | Age (years) | Height (cm) | Weight (kg) | GMFCS |
|---|---|---|---|---|
| M | \(\phantom{0}9\) | \(136\) | \(34.5\) | \(1\) |
| M | \(\phantom{0}7\) | \(106\) | \(16.2\) | \(2\) |
| M | \(\phantom{0}7\) | \(129\) | \(21.1\) | \(1\) |
| M | \(12\) | \(152\) | \(40.4\) | \(1\) |
| M | \(11\) | \(146\) | \(39.3\) | \(2\) |
| M | \(\phantom{0}5\) | \(113\) | \(18.1\) | \(1\) |
| M | \(\phantom{0}6\) | \(112\) | \(16.7\) | \(2\) |
| M | \(\phantom{0}8\) | \(112\) | \(19.1\) | \(1\) |
| M | \(\phantom{0}8\) | \(138\) | \(28.6\) | \(1\) |
| M | \(\phantom{0}6\) | \(116\) | \(19.3\) | \(1\) |
| F | \(\phantom{0}7\) | \(113\) | \(17.6\) | \(1\) |
| M | \(11\) | \(141\) | \(34.9\) | \(1\) |
| M | \(\phantom{0}7\) | \(136\) | \(34.5\) | \(1\) |
| F | \(\phantom{0}9\) | \(128\) | \(21.9\) | \(1\) |
| F | \(\phantom{0}8\) | \(133\) | \(23.0\) | \(1\) |
Exercise 10.14 Lane (2002) studied fertilizer use, and recorded the soil nitrogen after applying different fertilizer doses. These variables were recorded for each field:
- the fertilizer dose, in kilograms of nitrogen per hectare;
- the soil nitrogen, in kilograms of nitrogen per hectare; and
- the fertilizer source; one of 'inorganic' or 'organic'.
Classify the variables in the study.
Exercise 10.15 Brunton et al. (2019) recorded the response of kangaroos to overhead drones (one of 'No vigilance', 'Vigilance', 'Flee \(<10\)', or 'Flee \(>10\,\text{m}\)') and the altitude of the drone (\(30\,\text{m}\), \(60\,\text{m}\), \(100\,\text{m}\) or \(120\,\text{m}\)). The mob size and sex of the kangaroo was also recorded. Classify the variables in the study.
Exercise 10.16 Dokur, Petekkaya, and Karadağ (2018) studied people who died while taking selfies, and recorded the data in Table 10.4. Which of the following are the variables in the table? For each that is a variable, classify the variable.
- The location.
- The number of people who died at each location.
- The percentage of people who died at each location.
| Number | Percentage | |
|---|---|---|
| Nature, associated environments | \(48\) | \(43.2\) |
| Train, railway, associated structures | \(22\) | \(19.9\) |
| Buildings, associated structures | \(17\) | \(15.3\) |
| Road, bridge, associated structures | \(12\) | \(10.8\) |
| Dams, associated structures | \(\phantom{0}7\) | \(\phantom{0}6.3\) |
| Fields, farms, associated structures | \(\phantom{0}4\) | \(\phantom{0}3.6\) |
| Others | \(\phantom{0}1\) | \(\phantom{0}0.9\) |