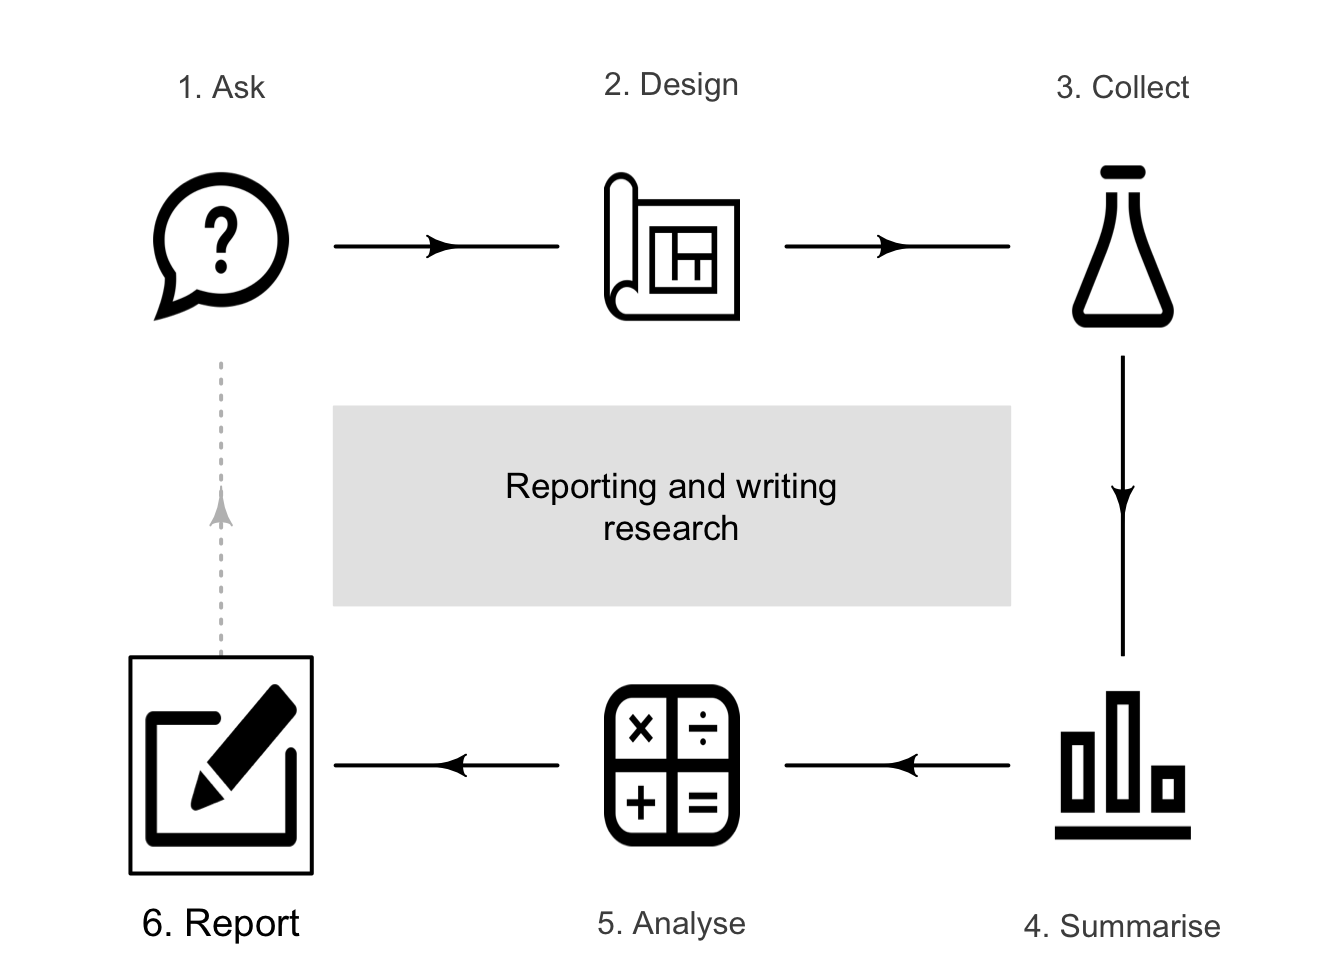
35 Reporting and writing research
So far, you have learnt the about the process of research: asking a RQ, designing a study, collecting data, describing and summarising the data, and analysing the data (confidence intervals; hypothesis tests). In this chapter, you will learn to:
- report research effectively and clearly.
- appropriately structure research writing.
35.1 Introduction

Research needs to be effectively communicated and shared, so the results can be used, evaluated and built on by others. The purpose of writing about research is to effectively and clearly communicate.
Research may be shared using face-to-face or online presentations (Sect. 35.4) or written documents (Sect. 35.5). The style and expectations vary widely between these two formats, between disciplines, and between journals in the same discipline. Hence, this chapter gives general comments about writing, rather than specific requirements. Formal guidelines for writing about research exist, for both experimental (Hopewell et al. 2022) and observational studies (Von Elm et al. 2007), though we will not discuss these specifically. Since different disciplines and journals have their own styles, read articles from your discipline or target journal for examples of the required style and formatting.
35.2 General writing advice
The purpose of writing about research is to effectively and clearly communicate the research. With this in mind, some general advice is given below.
Write carefully and precisely.
Use simple, clear but technically-correct language. Use the Glossary if necessary. Carefully choose every word you use to ensure it conveys the correct and intended meaning.
Oppenheimer (2006) concluded, from experimental studies, that students often believe the use of fancy words makes them appear smarter. However, he recommended students 'write clearly and simply if you can, and you'll be more likely to be thought of as intelligent' (p. 153).-
Use correct spelling, grammar, punctuation and formatting.
Use (but do not rely upon) a spell checker and grammar checker; use a dictionary. Specifically:- Do not confuse similar words (there/their/they're; your/you're; affect/effect; chose/choose; etc.).
- Capitalise correctly.
- Use apostrophes correctly. For example, it's is only ever an abbreviation for it is.
- Be careful with plurals. For example, 'a group was' rather than 'a group were'; 'the sample was' rather than 'the sample were'.
Be inclusive.
Unless specifically referring to men or women, use inclusive language (e.g., 'fire-fighter', not 'fireman'; 'nurse' rather than 'male nurse').Take care using comparative terms.
For example, writing 'this treatment is better' must be clarified. Better than what? And 'better' in what sense: cost? ease of use? patient outcomes?Use terminology consistently.
Different words may be used for the same concept in research and statistics. Use the term that is common in your discipline; most of all, be consistent.Be clear, concise and complete.
Place material in an Appendix (Sect. 35.5.8) if it will interrupt the flow of the narrative. Often, this material can be made available online if too lengthy in printed form.Ensure pronouns clearly identify the nouns they refer to.
For example, consider this sentence: 'When the weeds and crops were sprayed, its growth rate reduced by \(80\)%'. In this sentence, it is unclear what its refers to: the growth rate of the weeds, the crops, or both.Ensure verbs and nouns agree.
Both the nouns and verbs in a sentence should be singular or plural. For example, 'the rats was weighed' should be 'the rats were weighed'. Usually, 'data' is considered plural ('datum' is the singular; 'dataset' is also singular), so write 'the data were right skewed' rather than 'the data was right skewed' (but the latter use is becoming more common). In any case, be consistent.Avoid leaps of logic, and reaching conclusions unsupported by the evidence.
Ensure your conclusions are consistent with the evidence in the study.
For example, a student project found that the proportion of provisional drivers (those yet to get a full licence) was higher in the free university car park, compared to paid car parks. They concluded that provisional drivers seek to 'save money by parking in free car parks'. This may be true, but is not supported by the evidence. The evidence simply shows a difference in proportions, but does not explain why.Present the facts in an unbiased manner, and avoid promoting personal opinions.
For example, do not describe results as 'exciting'. Because academic writing generally shuns personal opinions, writing in third person ('the fertiliser was applied') is usually (but not always) preferred over writing in first person ('I applied the fertiliser').
Writing well is difficult; editing can be painful; revising is time-consuming. Revise your document carefully as many times as necessary; having someone else read and comment on your writing can be useful.
Many authors have stated variations of this phrase:
Don't write so that you can be understood; write so that you can't be misunderstood.
Be unambiguous: say what you mean, and mean what you say.
Example 35.1 (Write what you mean) A student project at my university asked:
Are dark-coloured car owners more likely to park undercover?
They actually meant:
Are drivers of dark-coloured cars more likely to park undercover?
Don't just be understood; avoid being misunderstood!
35.3 Ethics when writing
As always, ethical practice is important (Sect. 5), including when writing about research. Some relevant issues are given below.
Producing reproducible research.
When possible, research should be reproducible (Sect. 5.3). This includes describing the protocol, and making available any data (when possible; sometime this is not ethical or permitted) and any instructions or code used to analyse the data.Authorship.
Ensure that everyone who has made an intellectual contribution is listed as an author. Brand et al. (2015) suggests authorship be considered for those involved with:
- conceptualisation.
- methodology.
- software.
- data analysis.
- investigation.
- resourcing.
- data curation.
- creating images or taking photographs.
- writing, including writing drafts, reviewing and editing.
- visualization.
- supervision.
- project administration.
- funding acquisition.
Acknowledgements.
An optional Acknowledgements section can be used to acknowledge research funding bodies, and people who supported the research. Avoid writing 'The authors would like to thank...'; instead, actually thank them: 'We thank...'. Reviewers of the article (who are almost always volunteers) are usually thanked also.Use of artificial intelligence (AI).
Any use of AI in the study should be disclosed. This includes using AI during the research (e.g., generating figures or research design) or when writing about the research. The description should indicate where AI was used, which AI systems (such as ChatGPT) were used, and how they were used. AI also may make mistakes, so any material generated using AI should be verified by the authors.Plagiarism.
Writing about research almost always refers to, and builds on, others' work: to formulate the research question, to establish ideas and to explain the background of the research. However, plagiarism (using other people's words and ideas without acknowledgement) must be avoided. All sources used when writing research should be acknowledged.
Plagiarism is a serious offence: it is theft of intellectual property. Do not plagiarise; use quotes if necessary and cite the work of others as needed. Plagiarism applies to words, text, images, photographs, ideas, etc.
Example 35.2 (Plagiarism) Shamim (2014) published an article to discourage plagiarism. Later, the article was retracted because parts of the article were plagiarised.
35.4 Preparing presentations
Presentations are often used to share progress reports of research, or give an overview of completed research. They are used at conferences, workshops, and progress meetings, and may be given to peers, stakeholders, funding bodies, small groups of other researchers, or work teams. Presentations should be adapted to suit the time allocated and the audience: a conference presentation to your research peers should be different from a presentation to a progress meeting.
Presentations are mostly a verbal (speaking) and visual (preparing slides) medium.
As a verbal medium, speak slowly, clearly, loudly, and with expression. Use eye contact, and practice. Ensure you keep to your allocated time. Ensure technical or unusual words are pronounced correctly; aids to correct pronunciation of many unfamiliar terms have been given in this book.
As a visual medium, presentations usually omit technical details and give the audience an overview of the major points and processes; sharing tedious technical details is unlikely to produce an engaging presentation. Presentations usually focus on the why and the what of the research. Presentations may encourage audience members to learn more by reading your written documents (Sect. 35.5).
Presentations also tend to use graphs, images, short sentences, and minimal text. Presentation software encourages the use of fancy fonts, transitions and animations, but these are usually more distracting than informative; avoid. Ensure your fonts and colours are readable from a distance (especially in tables and graphs).
Using bullet points on slides, while common, is not necessary; short sentences are fine. Slides should not contain information that you simply read to the audience; a good presenter adds important details around the structure provided by information on the slides. The slides guide, but do not have to tell, your story of your research.
35.5 Writing articles
Written documents are more likely to be formally written and prepared than presentations. Unlike presentations, written documents tend to provide details of how the research was conducted. Written documents may be journal articles, progress reports, reports to stakeholders, or funding applications; these are all referred to as 'articles' in what follows, for brevity.
Journal articles, and most other written documents too, should contain sufficient details so that other professionals can repeat the study (Chap. 9.2); i.e., the research should, as far as possible, be reproducible (Sect. 5.3).
Articles usually have a more formal structure than presentations. Sometimes the acronym AIMRaD is used to remember these sections:
- Abstract,
- Introduction,
- Methods,
- Results, and
- Discussion (or Summary, or Conclusions).
These components capture the six-step research process in this book (Fig. 35.1).
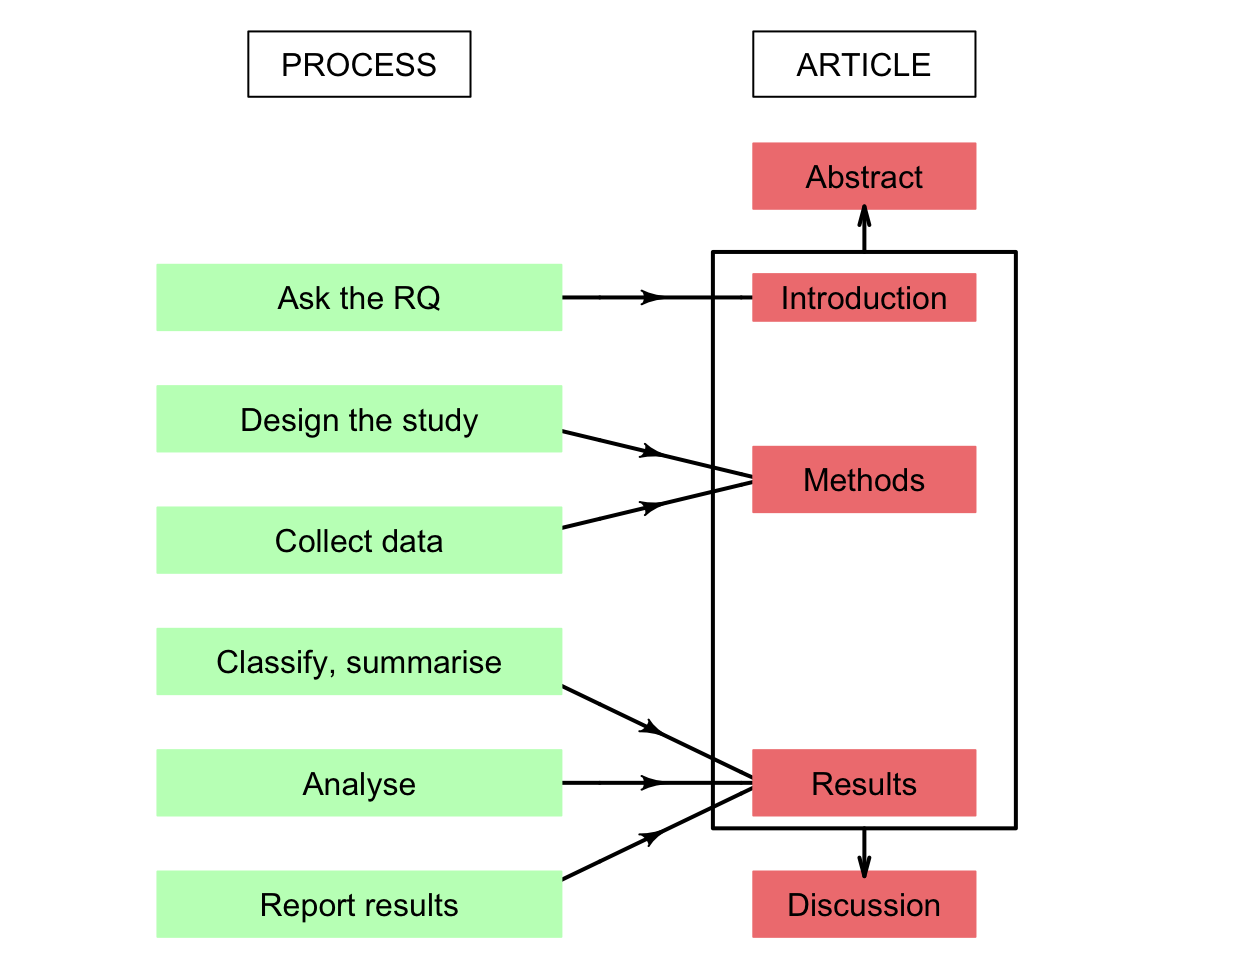
FIGURE 35.1: The connection between the article and the steps studied. The Abstract briefly covers all aspects of the study, and the Discussion explains what has been learnt through the process.
35.5.1 Article titles
Titles are important: poor titles can discourage a reader from reading an article. A title should clearly describe the main purpose of the article. Sometimes this is achieved by posing questions in the title ('Do warning lights and sirens reduce ambulance response times?'; Brown et al. (2000)) or providing answers in the title ('No harm from five year ingestion of oats in coeliac disease'; Janatuinen et al. (2002)).
As far as possible, avoid overly-specific technical language and uncommon abbreviations in the title.
35.5.2 Abstract
The Abstract (or Summary, or Overview) is a short section at the start of an article summarising the whole article, including the results; it is not an introduction. The Abstract is the most important part of any article: it is the only part that many people will read. Some journals require a structured abstract, where the Abstract contains specific headings (for example, Introduction, Methods, Results, and Conclusion (or Discussion)).
35.5.3 Introduction
The purpose of the Introduction is to:
- show how the research fills a gap in existing knowledge, by discussing existing literature (sometimes the Literature review forms a separate section).
- gain the interest of readers, and encourage them to read more of the article.
- establish the context and background.
- define the language, acronyms and definitions used in the study.
- introduce the theoretical groundwork of the subject.
- state the purpose of the article: why it was written, and what the authors hope to learn.
35.5.4 Methods
The Methods section (sometimes called Materials and Methods or similar) explains how the data were obtained. This includes:
- how the sample was identified and located.
- how the data were collected from the individuals (the data collection protocol).
- how external and internal validity was maximised, and confounding managed;
- how the data were analysed, including the software (and version number) used, and the statistical methods used.
- what specialized equipment was used (don't list pencils, rulers, paper, etc.).
35.5.5 Results
The Results summarise the conclusions from the analysis, especially regarding the initial RQ. The Results section:
- shows all the relevant findings from the research.
- presents a summary of the data: the number of observations, the number of missing values, and a verbal description of important variables.
- presents tabular, numerical and/or graphical summaries of the data and relationships of importance.
- gives a brief verbal interpretation of these summaries.
- gives the results from any hypothesis tests and confidence intervals.
- identifies trends, consistencies, anomalies, etc.
- does not provide interpretations or explanations of the results (that is the purpose of the Discussion).
Unless the dataset is small, the data itself is usually not given (though may appear in an Appendix or online).
35.5.6 Discussion
No new information should be presented in this section. This section:
- summarises the results.
- gives a short evaluation of the results.
- answers the stated RQ (i.e., makes a conclusion).
- discusses limitations (Chap. 8), strengths, weaknesses, problems, challenges.
- tries to anticipate and respond to potential questions about the research.
Readers should reach the conclusions based on the evidence presented. Sometimes, articles have separate Conclusion and Discussion sections; sometimes they are combined.
35.5.7 Referencing
The References (or Bibliography) section gives the full citations of any work referenced, in the required format (such as APA, Harvard, etc.). Most journals have strict guidelines for how references should be listed and formatted.
35.5.8 Appendices
Sometimes an Appendix is included, which contains important material that would otherwise break the flow of the article's narrative. The Appendix may include large tables, data, images, discussions of technical details, mathematical development, and so on. Sometimes, this material is placed online.
35.6 Specific advice
35.6.1 Constructing tables, graphs and images
Good figures and tables take time and care to prepare (Chap. 17). Their purpose should always be to display information in the simplest, clearest possible way, and to highlight the important information. In general, tables, graphs and images:
- should be discussed (not just presented) and referred to in the text.
- should be clear and uncluttered.
- should include units of measurement (such as kg or inches) where appropriate.
- should be able to be understood without reference to the article, as far as possible.
- should use easy-to-read fonts and colours: for example, ensure the font size is sufficiently large when placed in the article at the final size.
- should avoid using different colours, line types or fonts unless these have a purpose (i.e., to differentiate between groups in the study); if they are used, their purpose should be explained (e.g., using a figure legend).
- should not include chart junk (unnecessary additions), such as artificial third dimensions for graphs (Sect. 17.2) and unnecessary lines in tables.
Figures and images typically have captions below, while tables typically have captions above. The source of images (e.g., the photographer) should be acknowledged (as ethical practice), when appropriate. Table should use very few horizontal lines, and no vertical lines.
35.6.2 Presenting numbers
Any numbers presented should be rounded appropriately. Software may report more decimal places (or more significant figures) than necessary. When appropriate, ensure units of measurement are given.
Be consistent and careful with decimal numbers. Some journals require numbers to be written with a leading zero (e.g., \(P = 0.024\)), and some do not (e.g., \(P = .024\)). Counts are usually written in words when fewer than ten (or sometimes twelve), and otherwise presented using digits. However, numbers are written in full when starting a sentence ('Thirty-seven people volunteered').
Numbers taken from software output may need to be sensibly rounded before being included in a report (including in tables and graphs), and units of measurement added.
35.6.3 Lexically ambiguous words

Readers should not be able to misinterpret your meaning, so write carefully and precisely. One potential source of confusion is words with a different meaning in research compared to every-day use or in other disciplines (called lexical ambiguity; P. K. Dunn et al. (2016)). Some specific words where care is needed are given below.
- Average: In research, 'average' refers to any way of measuring the typical value (Sect. 11.6) including the mean and the median, but also other measures too (like geometric means, for instance). Use the specific word 'mean' or 'median' when that is what you intend.
- Confidence: In research, 'confidence' is usually used in the phrase 'confidence interval' (Sect. 24.4). Take care when using 'confidence' in other contexts.
- Control: In research, a 'control' is usually used in the context of a control group (Def. 2.16), but may have other meanings in other disciplines.
- Correlation: In research, correlation describes the (often linear) relationship between two quantitative variables (Sect. 16.4.1). In general use, 'correlation' may mean any 'association' between any two variables.
- Estimate: In research, 'estimating' means to calculate an estimate for an unknown population parameter using sample information. In general use, 'estimate' often means to make an educated guess.
- Experiment: In research, an experiment is a specific type of research study (Sect. 4.4). The word 'study' can be used to talk about research studies more generally.
- Independent: This word has many different uses in statistics and research, in science, and in general use. The word 'independent' in this book refers to events that do not impact each other in a probabilistic sense (Sect. 18.4).
- Intervention: In research, an 'intervention' (Sect. 2.7) is specifically when the researchers can manipulate the comparison.
- Normal: In research, 'normal' often refers to the 'normal distribution' (Chap. 20.3). If this is not the meaning you intend to convey, consider using the word 'usual' or similar.
- Odds: In research, 'odds' has a specific meaning (Sect. 12.5) and is not the same as probability. In general use, 'probability' and 'odds' are often used interchangeably.
- Population: In research, the 'population' refers to a larger group of interest (Def. 2.1). In general use, 'population' often refers to groups of people specifically.
- Random: In research, 'random' has a specific meaning: based on impersonal chance. In general usage, it often means 'haphazard' or 'without planning'.
- Regression: In research, 'regression' refers to the mathematical (often linear) relationship between two quantitative variables (Chap. 33).
- Sample: In research, we usually have 'one sample of \(30\) hyenas'; in some disciplines, this could be described as 'taking \(30\) samples of hyenas'.
- Significant: In research, 'significance' is usually understood to refer to 'statistical significance' (Sect. 28.6). If this is not the meaning you intend to convey, consider using the word 'substantial' or similar.
- Variable: In research, a 'variable' is a characteristic that can vary from individual to individual (Def. 2.9).
Some symbols may also have different meanings in other disciplines. Ensure the meaning of symbols and notation is clearly defined.
35.7 Chapter summary
Communicating research is a vital step in the research process. Writing clearly is important.
Presentations are a verbal and visual medium, and usually focus on the major points and conclusions rather than the how.
Written documents are usually formal, and include details of what was done. They should be written carefully and precisely, using the best technically-correct words. Use short sentences for easier reading and omit unnecessary words.
Remember: 'Don’t write so that you can be understood; write so that you can't be misunderstood'.
35.8 Quick review questions
Are these statements true or false?
- Using long, obscure words makes writing sound more scientific.
- Presentations generally focus on the details of how the study was done.
- The Introduction should explain why the study was done.
- Numbers should be given to as many decimal places as possible, for the greatest accuracy.
- The design of the study should be explained in detail in the Methods section.
35.9 Exercises
Answers to odd-numbered exercises are given at the end of the book.
Exercise 35.1
- Select the correct word to use to complete this sentence: to, too or two?
'Liquid fertiliser was applied [______] pots each morning at 9am.' - Select the correct word to use to complete this sentence: its or it's?
'Each kangaroo was observed for signs that [______] tracking device caused discomfort.' - What are the problems with this sentence?
'We took \(50\) samples of students; the average age of the \(50\) students was \(26.2\).' - What is the problem with this text?
'The subjects are not blinded. Because the subjects would clearly know they were in a study.'
Exercise 35.2
- Select the correct word to use to complete this sentence: there, their or they're?
'The subject were told to eat [______] snacks at about 8am.' - What is the problem with this text?
'The sample of pedestrians were all taken on a Thursday.' - Select the correct word to use to complete this sentence: affect or effect?
'The [______] of the diet was to increase the blood pressure.' - What is the problem with this sentence?
'The new formulation produces better concrete'.
Exercise 35.3
- Explain how this sentence can be misinterpreted, and write an improved version:
'There was one rat in the cage that was male.' - Explain how this sentence can be misinterpreted, and write an improved version:
'The research assistant recorded the pH of the lake water in the beaker after removing weeds.'
Exercise 35.4
- Explain how this sentence can be misinterpreted, and write an improved version:
'Fertiliser was applied to one of the fields that was in liquid form.' - Explain how this sentence can be misinterpreted, and write an improved version:
The new diet lost more weight, on average, than the traditional diet.'
Exercise 35.5
- Explain how this statement can be improved:
'A significant change in the weight gain of the pigs is expected to be found'. - Explain how this statement can be improved:
'The data is summarised in Table 2.'
Exercise 35.6
- Explain how this statement can be improved:
'There is a correlation between sex of the person and chance of contracting the disease'. - Explain how this statement can be improved:
'The group were asked to sign a consent form.'
Exercise 35.7 Oyerinde, Bamisaye, and Essien (2019) state (p. 1):
The regression correlation coefficients of \(0.999996066\) and \(0.999653453\) were obtained for the temperatures and speeds respectively [as associated with the time the engine had been running].
What is the problem with this statement?
Exercise 35.8 David et al. (2007) published an article entitled 'Are patients with self-inflicted injuries more likely to die?' What is the problem with this title?
Exercise 35.9 In a student project, students compared the mean reading speed for people when reading text displayed in one of two different fonts. Their RQ was:
Which font allows [...] students to read a pangram the fastest, between a default and what is considered to be a 'easy to read' font.
(A pangram is a sentence that uses every letter of the alphabet at least once.) In their Abstract, the conclusion was given as:
The Georgia font [...] is therefore the faster of the two.
- Explain why this is a poorly-worded RQ. Rewrite the RQ.
- Explain what is wrong with the conclusion. Rewrite the statement.
Exercise 35.10 In a student project, the heights that students could jump vertically were compared, starting from a squat or standing position. Every student in the study performed both jumps. Critique the numerical summary produced by the research team (Table 35.1).
| \(n\) | Mean | Standard deviation | Standard error | Confidence interval \(95\)% | \(t\) value | \(P\) value | |
|---|---|---|---|---|---|---|---|
| \(50\) | \(7.48\) | \(4.674\) | \(0.661\) | \(6.152\) to \(8.808\) | \(11.316\) | \(0.000\) |
Exercise 35.11 The aim of a student project was 'to determine if the proportion of males and females that use disposable cups on Campus is the same'. The two variables observed on each person in the study were (a) whether the person used a disposable cup, and (b) the sex of the person. In reporting the results in their Abstract, the students state:
Based on the sample results, the \(95\)% confidence interval for the population mean number of disposable cups used by males and females is between \(0.690\) and \(1.625\). Meaning that the population mean is likely to fall between those two intervals.
Critique this statement.
Exercise 35.12 The aim of a student project was 'to determine if the average hang time is different between two types of paper plane designs'. The two variables in the study were: design type (Basic Dart; Hunting Flight), and the hang time of the flight of the plane (in seconds). In reporting the results in their Abstract, the students state:
Very strong evidence proving a difference (\(P = .000\)) between the Basic Dart mean hang time (\(881.84\pm 140.73\,\text{ms}\)) and the Hunting Flight mean hang time (\(1504.19\pm 699.86\,\text{ms}\)). \(95\)% CI for the means of The Basic Dart (\(829.29\) -- \(934.39\)) and the Hunting Flight (\(1242.86\) -- \(1765.52\)).
Critique this statement.