Glossary
- \(68\)--\(95\)--\(99.7\) rule
- For any bell-shaped distribution, approximately \(68\)% of values lie within one standard deviation of the mean, \(95\)% of values lie within two standard deviations of the mean, and \(99.7\)% of values lie within three standard deviations of the mean. Also called the empirical rule. See also Normal distribution.
- Accuracy
- Accuracy refers to how close a sample estimate is likely to be to the population value, on average. See also Precision.
- Alternative hypothesis
- The alternative hypothesis proposes that the discrepancy between the proposed value of the parameter and the observed value of the statistic cannot be explained by sampling variation. It proposes that the value of the parameter is not the value claimed in the null hypothesis. See also Hypothesis test, Null hypothesis.
- Bell-shaped distributions
- See Normal distribution.
- Between-individual comparisons
- See Comparison (between individuals), Comparison.
- Bias
- Bias refers to any systematic misrepresentation of the target population caused by the sampling or the study design.
- Blinding
- Blinding occurs when those involved in the study do not know information about the study. A study can blind the researcher to knowing what comparison group the individuals are in, the participants to knowing what comparison group they are in, and/or the analysts to knowing what comparison group the individuals are in during analysis.
- Blocking
- Blocking occurs when units of analysis are analysed as separate groups of similar units (called blocks).
- Carry-over effect
- The carry-over effect occurs when the influence of one treatment or condition on the response variable influences the response variable for subsequent treatments or conditions (in a repeated-measures study).
- Cases
- The individual units in the population; the units of analysis. Also called individuals, or (when the individuals are people) subjects.
- Categorical data
- See Qualitative data.
- Cherry-picking
- A non-random sampling method where individuals are specifically chosen to reach the conclusion that the researchers want.
- Chi-square (\(\chi^2\)) score
- The test-statistic used to study the relationship between two qualitative variables. The \(\chi^2\)-statistic measures the overall size of the differences between the expected counts and observed counts, over the entire two-way table.
- Classical approach to probability
- In the classical approach to probability, the probability of an event occurring is the number of elements of the sample space included in the event, divided by the total number of elements in the sample space, when all outcomes are equally likely. See also Relative-frequency approach to probability, Sample space, Subjective approach to probability.
- Cluster sampling
- A random sampling method where the population is split into a large number of small groups called clusters, then a simple random sample of clusters is selected and every member of the chosen small groups is part of the sample. See also Simple random sample.
- Comparison
- In a RQ, a comparison may be within individuals, or between groups of individuals. See also Comparison (between individuals), Comparison (within individuals).
- Comparison (between individuals)
- The between-individuals comparison in the RQ identifies the small number of groups of different individuals for which the outcome is compared. See also Comparison, Comparison (within individuals).
- Comparison (within individuals)
- The within-individuals comparison in the RQ identifies the small number of different, distinct situations for which the outcome is compared for each individual. See also Comparison, Comparison (between individuals).
- Compound event
- A compound event is any combination of simple events. See also Event, Simple event.
- Conceptual definition
- A conceptual definition articulates precisely what words or phrases mean in a study. See also Operational definition.
- Conditions
- The conditions are the values of the comparison that those in the observational study experience, but are not manipulated or imposed by the researchers. See also Observational studies, Treatments.
- Confidence interval
- Informally: a confidence interval (CI) is an interval likely to contain the unknown value of the parameter. More formally, a CI is an interval which contains the unknown parameter a given percentage of the time (over repeated sampling). We studied CIs in some specific situations (see Sect. C.1); there are hundreds more.
- Confounding
- Confounding is when a third variable influences the observed relationship between the response and explanatory variable.
- Confounding variable
- A confounding variable (or a confounder) is an extraneous variable associated with the response and explanatory variables. See also Confounding variable, Extraneous variable.
- Continuous data
- Continuous quantitative data has (at least in theory) an infinite number of possible values between any two given values. See also Discrete data, Quantitative data.
- Control
- A control is a unit of analysis without the treatment or condition of interest, but as similar as possible in every other way to other units of analysis.
- Convenience sample
- A non-random sampling method where individuals are selected because they are convenient for the researcher.
- Correlation
- Correlation refers to the association between two variables, measured by a correlation coefficient.
- Correlation coefficient
- The (Pearson) correlation coefficient measures the strength and direction of the linear relationship between two quantitative variables. Its value is always between \(-1\) and \(1\).
- Correlational research question
- Correlational RQs explore the relationship between two quantitative variables.
- Data
- Data refers to information (observations or measurements), such as numbers, labels, recordings, videos, text, etc. (such as height of seedlings, or the type of medication given).
- Dataset
- A dataset refers to an organised and structured collection of data.
- Descriptive research question
- Descriptive RQs have a population and an outcome.
- Descriptive study
- Descriptive studies answer descriptive research questions.
- Discrete data
- Discrete quantitative data have a countable number of possible values between any two given values of the variable. See also Continuous data, Quantitative data.
- Distribution
- The distribution of a variable describes what values are present in the data, and how often those values appear. See also Normal distribution.
- Ecological validity
- A study is ecologically valid if the study methods, materials and context closely approximate the real situation of interest.
- Event
- An event is any combination of the elements in the sample space. See also Compound event, Sample space, Simple event.
- Exclusion criteria
- Exclusion criteria are characteristics that disqualify potential individuals from being included in the study. See also Inclusion criteria.
- Empirical rule
- See the \(68\)--\(95\)--\(99.7\) rule.
- Experimental studies (or Experiments)
- Experimental studies (or experiments) study relationships with an intervention. See also Intervention, Observational studies.
- Experimenter effect
- See Observer effect.
- Explanatory variable
- An explanatory variable may (partially) explain or be associated with changes in another variable of interest (the response variable). In an experimental study, it is the variable that can be manipulated by the researchers. See also Response variable.
- External validity
- External validity refers to the ability to generalise the results of the study to the rest of the population, beyond just those in the studied sample. For a study to be truly externally valid, the sample must be a random sample from the population. See also Internal validity.
- Extraneous variable
- An extraneous variable is any variable associated with the response variable, but is not the explanatory variable. See also Confounding variable, Lurking variable.
- Extrapolation
- Extrapolation refers to making prediction outside the range of the available data. Extrapolation beyond the data may lead to nonsense.
- Hawthorne effect
- The Hawthorne effect is the tendency of individuals to change their behaviour if they know (or think) they are being observed.
- Hypothesis
- A hypothesis is a possible answer to a (research) question. See also Alternative hypothesis, Hypothesis test, Null hypothesis.
- Hypothesis test
- A hypothesis test is a way to formally answer questions about a population, based on information obtained from a sample. In this book, we have looked at some specific hypothesis tests (see Sect. C.1); hundreds more exist.
- Inclusion criteria
- Inclusion criteria are characteristics that individuals must meet explicitly to be included in the study. See also Exclusion criteria.
- Independence
- Two events are independent if the probability of one event doesn't change depending on whether or not other event has happened.
- Individuals
- The individual units in the population from which the observations of interest could be made; the units of analysis. Also called Cases, or Subjects when the individuals are people. See also Units of analysis.
- Internal validity
- Internally validity refers to the extent to which a cause-and-effect relationship can be established in a study. A study with high internal validity shows that the changes in the response variable can be (at least partially) attributed to changes in the explanatory variables; other explanations have been ruled out. See also External validity.
- Intervention
- An intervention is present when researchers can manipulate (or impose) the values of the explanatory variable on the individuals to determine the impact on the response variable.
- IQR
- The IQR is a measure of variation. The IQR is the range in which the middle \(50\)% of the data lie; the difference between the third and the first quartiles. See also Quartiles.
- IQR rule for identifying outliers
- The IQR rule can identify outliers as either extreme (observations \(3\times\text{IQR}\) more unusual than \(Q_1\) or \(Q_3\)) or mild (observations \(1.5\times \text{IQR}\) more unusual than \(Q_1\) or \(Q_3\), that are not extreme outliers).
- Jittering
- Jittering is when a small amount of randomness is added in either the horizontal or vertical direction (or sometimes both) to separate points that would otherwise be overplotted. See also Overplotting, Stacking.
- Judgement sample
- A non-random sampling method where individuals are selected, based on the researchers' judgement, depending on whether the researcher thinks they are likely to be agreeable or helpful.
- Levels of a qualitative variable
- The levels (or the values) of a qualitative variable refer to the names of the distinct categories of the variable.
- Lurking variable
- A lurking variable is an extraneous variable associated with the response and explanatory variables (that is, a confounding variable), but whose values are not recorded in the study data. See also Confounding variable, Extraneous variable.
- Mean
- The mean is one way to measure the 'average' value of quantitative data. The arithmetic mean is the 'balance point' of the data. The positive and negative distances from the mean add to zero. See also Median.
- Median
- The median is one way to measure the 'average' value of some data. A median is a value such that half the values are larger than the median, and half the values are smaller than the median. See also Mean.
- Mode
- A mode is the level (or levels) of a qualitative variable with the most observations.
- Multi-stage sampling
- A random sampling method where large groups are selected using a simple random sample, then smaller groups within those large groups are selected using a simple random sample. The simple randomly sampling can continue for as many levels as necessary. See also Simple random sample.
- Nominal variable
- A nominal qualitative variable is a qualitative variable where the levels do not have a natural order. See also Ordinal variable, Qualitative data.
- Non-response bias
- Non-response bias occurs when chosen participants do not respond. See also Bias.
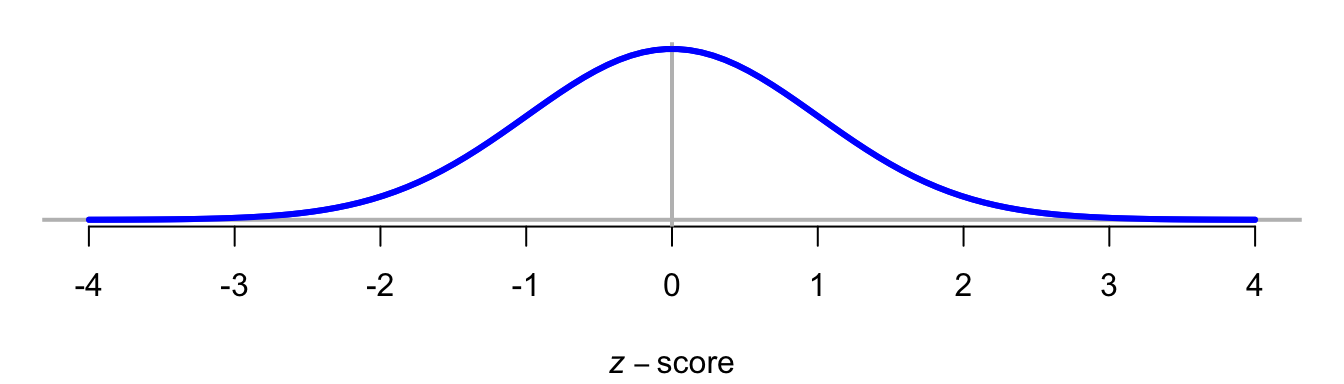
- Normal distribution
- A normal distribution is symmetrical distribution, with most values near the centre of the distribution (the mean). The normal distribution is described by its mean and standard deviation. A picture of a normal distribution is shown below. Normal distributions are also called bell-shaped distributions. See also \(68--95--99.5\) rule.
- Null hypothesis
- The null hypothesis proposes that sampling variation explains the discrepancy between the proposed value of the parameter, and the observed value of the statistic. See also Alternative hypothesis, Hypothesis test.
- Observational studies
- Observational studies study relationships without an intervention. See also Experimental studies.
- Observer effect
- The observer effect occurs when the researchers (unconsciously) change their behaviour to conform to expectations because they know what values of the explanatory variable apply to the individuals. This may then cause the individuals to change their behaviour or reporting also.
- Odds
- The odds are the number (or proportion, or percentage) of results of interest, divided by the remaining number (or proportion, or percentage) of results. See also Probability.
- Odds ratio
- The odds ratio is how many times greater the odds of an event are in one group, compared to the odds of the same event in a different group. See also Odds.
- Operational definition
- An operational definition articulates exactly how something will be identified, measured, observed or assessed. See also Conceptual definition.
- Ordinal variable
- An ordinal qualitative variable is a qualitative variable where the levels do have a natural order. See also Nominal variable, Qualitative data.
- Overplotting
- Overplotting occurs when observations in a scatterplot or dot plot have the same, or nearly the same, values, and so are plotted at the same, or nearly the same, places on the graph. See also Jittering, Stacking.
- Outcome
- The outcome in a RQ is the result, output, consequence or effect of interest in a study, numerically summarised for a group of individuals.
- Outliers
- An outlier is an observation that is 'unusual' (either larger or smaller) compared to the bulk of the data. Rules for identifying outliers are arbitrary. See also IQR rule for identifying outliers, Standard deviation rule for identifying outliers.
- \(P\)-value
- A \(P\)-value is the probability of observing the sample results (or something even more extreme) over repeated sampling, under the assumption that the null hypothesis about the population is true. \(P\)-values are used in decision-making. See also Hypothesis testing.
- Parameter
- A parameter is a number, usually unknown, describing some feature of a population, and estimated by a statistic. See also Statistic.
- Paired data
- Paired data occurs when the outcome in repeated-measures studies is compared for two different, distinct situations for each unit of analysis.
- Percentage
- A percentage is a proportion, multiplied by \(100\). In this context, percentages are numbers between \(0\)% and \(100\)%. See also Proportion.
- Percentiles
- The \(p\)th percentile of the data is a value separating the smallest \(p\)% of the data from the rest. See also Quartiles.
- Pilot study
- A pilot study is a small test run of the study used to check that the protocol is appropriate and practical, and to identify (and hence fix) possible problems with the research design or protocol.
- Placebo
- A placebo is a treatment with no intended effect or active ingredient, but appears to be the real treatment.
- Placebo effect
- The placebo effect occurs when individuals report perceived or actual effects despite not receiving an active treatment or condition, in experimental studies. See also Placebo.
- Plagiarism
- Plagiarism is using other people’s ideas and research to develop new conclusions, or confirm existing conclusions. All sources used when writing research should be acknowledged to avoid plagiarism.
- Population
- A population is a group of individuals (or cases, or subjects if the individuals are people) from which the total set of observations of interest could be made, and to which the results will generalise. See also Individuals, Sample, Units of analysis.
- Precision
- Precision refers to how similar the sample estimates from different samples are likely to be to each other (that is, how much variation is likely in the sample estimates). See also Accuracy.
- Probability
- A probability is a number between \(0\) and \(1\) inclusive (or between \(0\)% and \(100\)% inclusive) that quantifies the likelihood that a certain event will occur. A probability of zero (or \(0\)%) means the event is 'impossible' (will never occur), and a probability of one (or \(100\)%) means that the event is certain to happen (will always occur). Most events have a probability between the extremes of \(0\)% and \(100\)%. See also Odds.
- Proportion
- A proportion is a fraction out of a total. Proportions are numbers between \(0\) and \(1\). See also Percentage.
- Protocol
- A protocol is a predefined procedure detailing the design and implementation of studies, and for data collection.
- Qualitative data
- Qualitative data are not mathematically numerical data: they comprise mutually exclusive, exhaustive categories or labels (even if those labels are numbers). Also called Ordinal variable, Qualitative data, Quantitative data.
- Quantitative data
- Quantitative data are mathematically numerical: the numbers have numerical meaning, and represent quantities or amounts. Quantitative data generally arise from counting or measuring. Also called Continuous data, Discrete data, Qualitative data.
- Quantitative research
- Quantitative research summarises and analyses data (quantitative or qualitative data) using numerical methods, such as producing averages and percentages.
- Quartiles
-
Quartiles describe the variation and shape of data.
The first quartile \(Q_1\) is a value that separates the smallest \(25\)% of observations from the largest \(75\)%; it is like the median of the smaller half of the data, halfway between the minimum value and the median.
The second quartile \(Q_2\) is a value that separates the smallest \(50\)% of observations from the largest \(50\)% (and is the median).
The third quartile \(Q_3\) is a value that separates the smallest \(75\)% of observations from the largest \(25\)%; it is like the median of the larger half of the data, halfway between the median and the maximum value. See also Median, Percentiles. - Quasi-experiment
- In a quasi-experiment, the researchers (1) allocate treatments to groups of individuals (i.e., allocate the values of the explanatory variable to the individuals, as it is an experiment), but (2) do not determine who or what is in those groups. See also True experiment.
- Questionnaire
- A questionnaire is a set of questions for respondents to answer.
- Random
- Random means 'determined completely by impersonal chance'. See also Simple random sample.
- Random procedure
- A random procedure is a sequence of well-defined steps that (a) can be repeated, in theory, indefinitely under essentially identical conditions; (b) has well-defined results; and (c) has result that are unpredictable for any individual repetition.
- Range
- The range is a measure of variation. The range is the maximum value minus the minimum value.
- Relational research question
- Relational RQs have a population, outcome, and a between-individuals comparison.
- Relative frequency approach to probability
- In the relative frequency approach to probability, the probability of an event is approximately the number of times the outcomes of interest has appeared in the past, divided by the number of 'attempts' in the past. This produces an approximate probability. See also Classical approach to probability, Subjective approach to probability.
- Repeated-measures research question
- Repeated-measures RQs have a population, outcome and a within-individuals comparison.
- Representative samples
- A sample where the individuals in the sample are not likely to be different the individuals not in the sample, at least for the variables of interest.
- Research design
- Research design refers to the decisions made by the researchers to maximise external validity and internal validity.
- Response bias
- Response bias occurs when participants provide incorrect or false information.
- Response variable
- A response variable records the result, output, consequence or effect of interest from changes in another variable (the explanatory variable). See also Explanatory variable.
- Sample
- A sample is a subset of individuals from the population. The data are collected from the sample. Usually, countless possible samples could be obtained from a population. See also Population.
- Sample space
- The sample space is a list of all possible and distinct results after administering a random procedure once. See also Event.
- Sampling distribution
- A sampling distribution is the distribution of a statistic, showing how its value varies across all possible samples. See also Sampling mean, Standard error.
- Sampling frame
- The sampling frame is a list of all the individuals in the population.
- Sampling mean
- The sampling mean is the mean of the sampling distribution of a statistic: the mean of the values of the statistic from all possible samples. See also Sampling distribution, Sampling mean, Sampling variation, Standard error.
- Sampling variation
- Sampling variation refers to how the sample estimates (statistics) vary from sample to sample, because every possible sample is different. See also Sampling distribution, Sampling mean, Standard error.
- Selection bias
- Selection bias is the tendency of a sample to over- or under-estimate a population quantity. See also Bias.
- Scale data
- See Quantitative data.
- Simple event
- A simple event is a single element of the sample space. See also Compound event, Event, Sample space.
- Simple random sample
- A random sampling method where every possible sample of a given size has same chance of being selected.
- Stacking
- Stacking is when points are plotted above other points with similar values, to separate points that would otherwise be overplotted. See also Jittering, Stacking.
- Standard deviation
- The standard deviation is a measure of variation. The standard deviation is, approximately, the mean distance of observations from the mean.
- Standard deviation rule for identifying outliers
- For approximately symmetric distributions, any observation more than three standard deviations from the mean can be considered an outlier.
- Standard error
- A standard error is the standard deviation of all possible values of the sample estimate (from samples of a certain size): the standard deviation of the values of the statistic from all possible samples. Any quantity estimated from a sample has a standard error. See also Sampling distribution, Sampling mean, Sampling variation.
- Stratified sampling
- A random sampling method where the population is split into a small number of large (usually homogeneous) groups called strata, then cases are selected using a simple random sample from each stratum. See also Simple random sample.
- Statistic
- A statistic is a number describing some feature of a sample (to estimate the unknown value of the population parameter). See also Parameter.
- Statistical validity
- A result is statistically valid if the conditions for the underlying mathematical calculations to be approximately correct are met, such as the sampling distribution having an approximate normal distribution. Every confidence interval and hypothesis test has statistical validity conditions.
- Subjective approach to probability
- In the subjective approach to probability, various factors are incorporated, perhaps subjectively, to determine the probability of an event occurring. See also Relative-frequency approach to probability, Subjective approach to probability.
- Subjects
- The individual units in the population when the units are people; the units of analysis. Also called individuals or cases; however, those two terms do not refer exclusively to people. See also Units of analysis.
- Systematic sampling
- A random sampling method where the first case is randomly selected; then, every \(n\)th individual is selected.
- \(t\)-score
- A \(t\)-score measures how many standard deviations a value is from the mean. A \(t\)-score is similar to a \(z\)-score. See also \(z\)-score.
- Treatments
- The treatments are the values of the explanatory variable that the researchers can manipulate and impose upon the individuals in the experimental study. See also Conditions, Experiments.
- True experiment
- In a true experiment, the researchers (1) allocate treatments to groups of individuals (i.e., values of the explanatory variable to the individuals), and (2) determine who or what is in those groups. While the steps may not happen explicit, they happen conceptually. See also Quasi-experiment.
- Unit of observation
- The unit of observation is the 'who' or 'what' that is observed, from which measurements are taken and data collected. See also Unit of analysis.
- Unit of analysis
- The unit of analysis are the smallest collection of units of observations (and perhaps the units of observations themselves) about which conclusions are made; the smallest independent elements of the population for which information is analysed. In an experimental study, the unit of analysis is the smallest collection of units of observations that can be randomly allocated to separate treatments. See also Individuals, Unit of observation.
- Unstandardising formula
- When the \(z\)-score is known, the unstandardising formula determines the corresponding value of the observation \(x\). See also \(z\)-score.
- Values of a qualitative variable
- See Levels.
- Variable
- A variable is a single aspect or characteristic associated with the individuals, whose values can vary from individual to individual.
- Voluntary response (self-selecting) sample
- A non-random sampling method where individuals participate if they wish to.
- Within-individuals comparison
- See Comparison (within individuals), Comparison.
- \(z\)-score
- A \(z\)-score measures how many standard deviations a value is from the mean. In symbols: \[ z = \frac{\text{value} - \text{mean of the distribution}}{\text{standard deviation of the distribution}} = \frac{x - \mu}{\sigma} \] where \(x\) is the value, \(\mu\) is the mean of the distribution, and \(\sigma\) is the standard deviation of the distribution. See also \(t\)-score.