1 Research: an introduction
In this chapter, you will learn to:
- identify quantitative and qualitative research.
- identify the steps in the quantitative research process.
1.1 Introduction: how we know what we know
Scientists once believed that all life regularly and commonly arose spontaneously from non-living matter. Recipes even existed; for example, van Helmont (van Helmont 1671; Pasteur 1922) gave this recipe for making a mouse:
If a soiled shirt is placed in the opening of a vessel containing grains of wheat, the reaction of the leaven in the shirt with fumes from the wheat will, after approximately twenty-one days, transform the wheat into mice.
This was called 'spontaneous generation' (or 'abiogenesis'). This theory is clearly incorrect, so how did the idea emerge? How was it disproven? Through observation and research.
Spontaneous generation was consistent with observations: following the above recipe did produce mice. However, the hypothesis ('possible explanation') of spontaneous generation was rejected when later evidence, in better-designed research studies, contradicted the hypothesis. A new hypothesis was proposed to explain the appearance of the mice, which was tested against the evidence, and so on. Briefly, this is the evidence-based, scientific process.
As a more recent example, the dangers of smoking were still being debated into the 1990s:
... a causal role for smoking [has] not been proved beyond reasonable doubt.
--- Eysenck (1991), p. 429
All scientific knowledge emerges in a similar way: observations lead to hypotheses, which are tested against evidence. If the evidence contradicts the hypothesis, the hypothesis is rejected. If the evidence is consistent with the hypothesis, the hypothesis is temporarily accepted (until any contradictory evidence emerges, if ever).
Hypotheses not contradicted by large amounts of evidence, over a long time, are sometimes called laws or theories (such as the 'Law of conservation of energy'). Theories and laws can be disproven if contradictory evidence emerges. Knowledge in all scientific disciplines is accumulated using a similar evidence-based process.
1.2 Evidence-based research
Every discipline changes, develops, improves, and adapts---usually through research. Your discipline is not the same as it was \(10\) years ago; it will change in the next \(10\) years. Scientists, engineers and health practitioners need to know how to understand and adapt to this change.
Remaining current in your discipline requires understanding research, even if you will not be researching yourself. You still need to know the language, tools, concepts and ideas of research, and you need to be able to critique research. Research is the foundation of science.
Scientific seeks evidence-based answers: reaching conclusions based on evidence, rather than hunches, feelings, intuition, hopes, or tradition. The evidence comes from analysing data.
Definition 1.1 (Data) Data refers to information (observations or measurements), such as numbers, labels, recordings, videos, text, etc.
A dataset refers to an organised and structured collection of data.
Research involves asking research questions, designing studies to collect data, and analysing data. This book covers all these components.
1.3 Quantitative, qualitative, and mixed-methods research
Research can be broadly classified as qualitative or quantitative. These are different yet complementary approaches to answering research questions (Table 1.1). Both methods have advantages and disadvantages, and can be used together (called mixed-methods research). The decision to use qualitative, quantitative or mixed-methods approaches depends on the purpose of the research.

|

|
|
| Qualitative | Aspect | Quantitative |
| Feelings, opinions | What | Measured or observed data |
| Suggest hypotheses, explore, depth | Why | Make objective conclusions |
| Non-random samples | Studied | Representative, random samples |
| Detailed; for specific groups | Conclusions | General |
| Words, audio, video, pictures, ... | Data | Numbers, measurements, counts, ... |
| Usually small samples are studied | Size | Often large samples are studied |
| Often time-consuming | Time | More efficient |
| Rarely generalisable | Applicability | Often generalisable |
| Thematic analysis, content analysis, etc. | Analysis | Numerical summaries, test hypotheses |
| Interviews, focus groups | Examples | Experiments, closed surveys, lab. studies |
Briefly, qualitative research leads to a deeper understanding, usually for a very narrowly-defined group. Meanings, motivations, opinions or themes often emerge from qualitative research. In contrast, quantitative research summarises and analyses data usually from large groups, using numerical methods, such as averages and percentages. In quantitative research, typically information about a large group of interest (a population) is found from a subset of the population (a sample).
Definition 1.2 (Quantitative research) Quantitative research summarises and analyses data using numerical methods, such as averages, proportions and percentages.
This book is about quantitative research.

Example 1.1 (Types of research) Oliveira et al. (2020) used mixed-methods research to study the adoption of electric taxis in Nottingham (UK).
In the quantitative component of the study, taxis were tracked for over \(32\,000\,\text{km}\) and \(9\,764\,\text{h}\). The researchers determined where taxis often stopped (as potential charging locations). The Trent Street taxi rank (near the main train station) was the most-used stop with an average wait time of \(20\,\text{mins}\); Milton St (\(17\,\text{mins}\)) and Wheeler gate (\(10\,\text{mins}\)) also recorded high average stop-times. Numerical information about speeds was also obtained.
In the qualitative component of the study, nine taxis drivers participated in interviews and focus groups. This allowed the researchers to (p. 6)
...explore themes and motivations in a way that was not possible with the initial quantitative analysis.
Participants' responses were classified as facilitators (opportunities to charge regularly; convenient locations) and barriers (safety; costs; speeds) to the proposed charging locations.
Example 1.2 (Quantitative research) During 1988/1989, an unusually high number of Legionella longbeachae infections were observed in South Australians. The researchers (O’Connor et al. 2007) wanted to identify the source to prevent further infections.
The researchers noticed that many of those infected were gardeners who had recently handled potting mix, so they hypothesised that the infection was associated with using potting mix. They designed a study to test this hypothesis, then collected data from \(100\) people (\(25\) with the infection, and \(75\) people of similar age and sex without the infection).
The researchers classified and summarised the data, then analysed the data to reach an evidence-based conclusion: potting mix was partially, but not solely, responsible for the infections. The researchers communicated their recommendations to reduce the risks of people contracting the infection in the future.
This book explains the six steps of research. Arrange these steps into the common order:
Step 1: the question.
Step 2: the study.
Step 3: the data.
Step 4: the data.
Step 5: the data.
Step 6: the results.
1.4 The steps in research
The research process (for both qualitative and quantitative research) ideally follows the process summarised in Fig. 1.1, but this is not always possible or practical. The process is not always linear: researchers may jump from step to step as necessary, and research often leads to new research questions so that the process restarts. Each step is important:
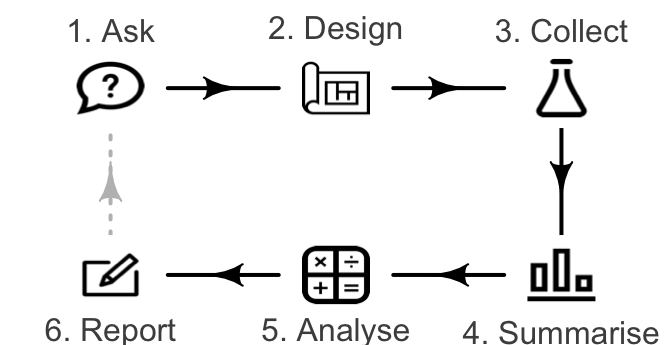
FIGURE 1.1: The six basic steps in research.
- Asking the research question (Chap. 2). Research begins with a question to answer.
- Designing the study (Chaps. 3 to 8). Evidence-based research uses data to answer the question. A study is designed to obtain that data: determining who or what to study, how to find them, what information to obtain, and ensuring data are obtained ethically.
- Collecting the data (Chap. 9). The data collection process must be ethical, reproducible and clearly documented.
- Classifying and summarising the data (Chaps. 10 to 17). Before analysis, the data must be classified and summarised to inform the analysis. (A computer is useful.)
- Analysing the data (Chaps. 18 to 33). Analysis refers using the data to find an answer to the research question. (A computer is useful.)
- Reporting the results (Chaps. 35 and 36). Communicating the results appropriately, accurately and ethically is important, including identification of any limitations.
1.5 Using computers in research
Statistical software (such as python, jamovi, R, SAS, SPSS, Stata, etc.) is useful for summarising and analysing data. Statistical software:
- is designed for working with large datasets.
- encourages reproducible research (Sect. 5.3).
- allows high-precision formatting and graphics.
- is powerful; with some programming skills, almost anything is possible.
- is specifically designed for analysing and working with data.
This book sometimes shows output from jamovi (The jamovi Project 2022), but using jamovi is not essential for understanding this book.
Using spreadsheets for storing and analysing data requires care. Expensive and dangerous errors have been made due to using spreadsheets (AlTarawneh and Thorne 2016). Some challenges with using spreadsheets include that:
- spreadsheets may change data (e.g., reformatting entries as dates) when not appropriate (Ziemann, Eren, and El-Osta 2016).
- spreadsheets may include formulas with errors that are difficult to locate and hence fix (Panko 2015; London and Slagter 2021).
- Spreadsheets do not leave a record of how the data were analysed or prepared. Keeping a record of the analysis, preparation of variables, and other operations with the data is good scientific practice (reproducible research; see Sect. 5.3) (Simons and Holmes 2019).
- spreadsheets often produce poor graphs (Su 2008).
Problems with spreadsheets, as with any software, are often due to human error, but spreadsheets make errors hard to find and hence hard to fix. Spreadsheets are useful for data collection and basic data manipulation, but are not designed for scientific analysis. Be careful using spreadsheets for research and analysis.
1.6 Exercises
Answers to odd-numbered exercises are given at the end of the book.
Exercise 1.1 Consider the research question: 'For three different junctional tourniquets, which is the quickest, on average, to apply?'
- What data would be likely be needed to answer this research question?
- Is this RQ likely to be answered using a quantitative or qualitative research study? Explain.
Exercise 1.2 Consider the research question: 'Why do people dump rubbish in mangroves?'
- What data would be likely be needed to answer this research question?
- Is this RQ likely to be answered using a quantitative or qualitative research study? Explain.
Exercise 1.3 Consider the research question: 'What percentage of the population have side effects from a medication?'
- What data would be likely be needed to answer this research question?
- Is this RQ likely to be answered using a quantitative or qualitative research study? Explain.
Exercise 1.4 Consider the research question: 'What is the average number of rooftop solar panels on domestic homes in a certain city?'
- What data would be likely be needed to answer this research question?
- Is this RQ likely to be answered using a quantitative or qualitative research study? Explain.
Exercise 1.5 Frost and Murtagh (2023) conducted a study to better understand the views of adults regarding planting greenery in front gardens. To do so, they conducted (p. 80):
... five online focus groups with \(20\) participants aged \(20\)--\(64\) in England...[then] audio recorded each focus group, transcribed it verbatim and analysed transcripts using thematic analysis.
What type of research study is this: qualitative, quantitative or mixed-methods?
Exercise 1.6 Häußermann et al. (2023) studied Germany's transition to green energy, and (p. 1):
... investigated social acceptance of green hydrogen at an early stage in its implementation, before wider rollout.
To do so, they used (p. 1):
... semi-structured interviews (\(n = 24\)) and two participatory workshops (\(n = 51\)) in a selected region in central Germany serve alongside a representative survey (\(n = 2\,054\))...
What type of research study is this: qualitative, quantitative or mixed-methods?