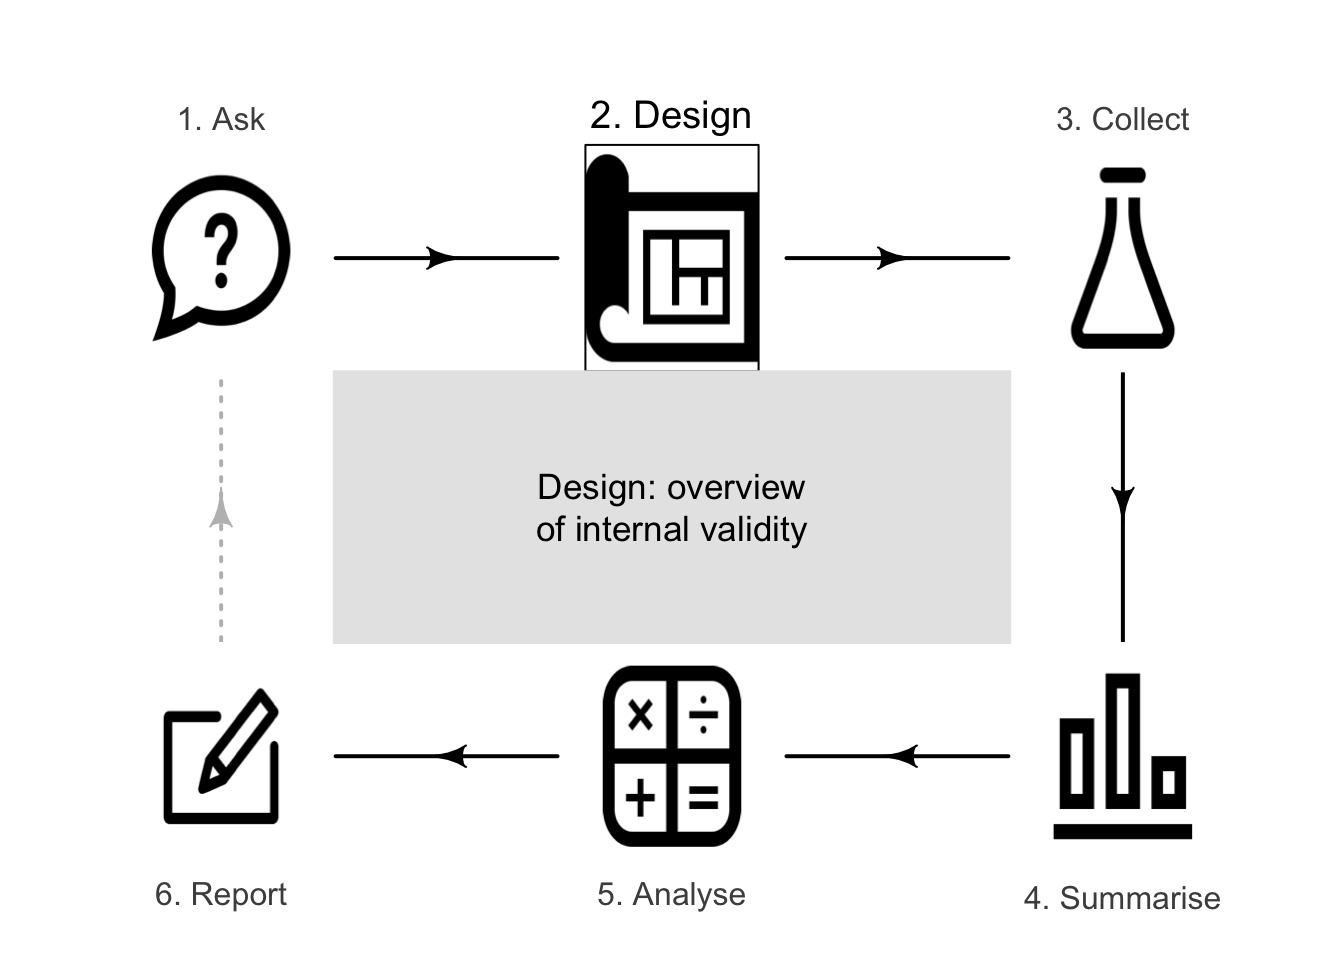
3 Overview of research design
So far, you have learnt to ask a RQ. In this chapter, you will learn why design is important for understanding variation in the response variable. You will learn to:
- identify reasons why the value of the response variable varies.
- identify and distinguish extraneous, confounding and lurking variables.
- understand how chance impacts the values of the response variable.
3.1 Internal and external validity
A RQ about a population is answered using data collected from a well-designed research study. However, studying every member of a population is generally impossible due to cost, time, ethics, logistics and/or practicality. Usually a subset of the population (a sample) is studied, comprising some individuals from the population. Countless different samples are possible.
Being able to generalise about the population of interest from studying a sample is called external validity. Chapter 6 discusses how to select a suitable sample to study.
One challenge of research is learning about a population from studying just one of the countless possible samples.
Definition 3.1 (External validity) External validity refers to the ability to generalise the results to the rest of the population, beyond just those in the sample studied.
Apart from being externally validity, well-designed research studies should be internally valid: studies that allow the researchers to focus on the relationship of interest in the population between the response and explanatory variable. Internally valid studies eliminate, or account for, other explanations for the variation in the values of the response variable.
One challenge of research is learning about the relationship between the response and explanatory variables, when the value of the response variable can also be influenced by other factors.
Definition 3.2 (Internal validity) Internally validity refers to the extent to which a cause-and-effect relationship can be established in a study.
A study with high internal validity shows that the changes in the response variable can be attributed to changes in the explanatory variables; other explanations have been ruled out.
Studies with low internal validity leave open other possibilities, apart from changes in value of the explanatory variable, to explain changes in the value of the response variable. Ideally, all studies should be designed to be internally valid as far as possible. For this reason, internal validity is studied in more detail in Chap. 7. The sections that follow discuss other reasons for changes in the value of the response variable.

3.2 Values of the response variable vary

In any study, the values of the response variable vary. Many reasons explain why these values vary.
Example 3.1 (Study design) Consider this RQ:
For students in a large university course, is the average typing speed (in words per minute) the same for those aged under \(25\) ('younger') and \(25\) or over ('older')?
The typing speeds (the response variable) of the many individuals will vary: every student in the study recording exactly the same typing speed is highly unlikely. The variation in the typing speeds (Fig. 3.1) may be due to various reasons:
- The explanatory variable (Sect. 3.3): The values of the explanatory variable may influence the values of the response variable. Of course, they may not either; the purpose of the study is to find if, or to what extent, this is true. In this example, the explanatory variable is the age group of the student.
- Other variables, called extraneous variables (Sect. 3.4): Other variables (apart from the explanatory variable) may influence the response variable (perhaps more so than the explanatory variable), such as 'sex of the person', or 'whether or not the person wears glasses'. The impact of these variables can be accommodated if the study is designed appropriately.
- Chance (or randomness or natural variation) (Sect. 3.5): The same person doing the same thing repeatedly under the same conditions will not record exactly the same typing speed every attempt. This is unavoidable, but good research design can minimize the size of this variation.
Designing studies to maximize internal validity requires identifying important extraneous variables, and eliminating (as far as possible) anything that obscures the relationship between the response and explanatory variables.
Example 3.2 (Design) In the typing-speed study, suppose females were always asked to use their dominant hand, and males always asked to use their non-dominant hand. Females would probably have a faster average time, simply because they use their dominant hands. Using this research design would produce a study with poor internal validity.
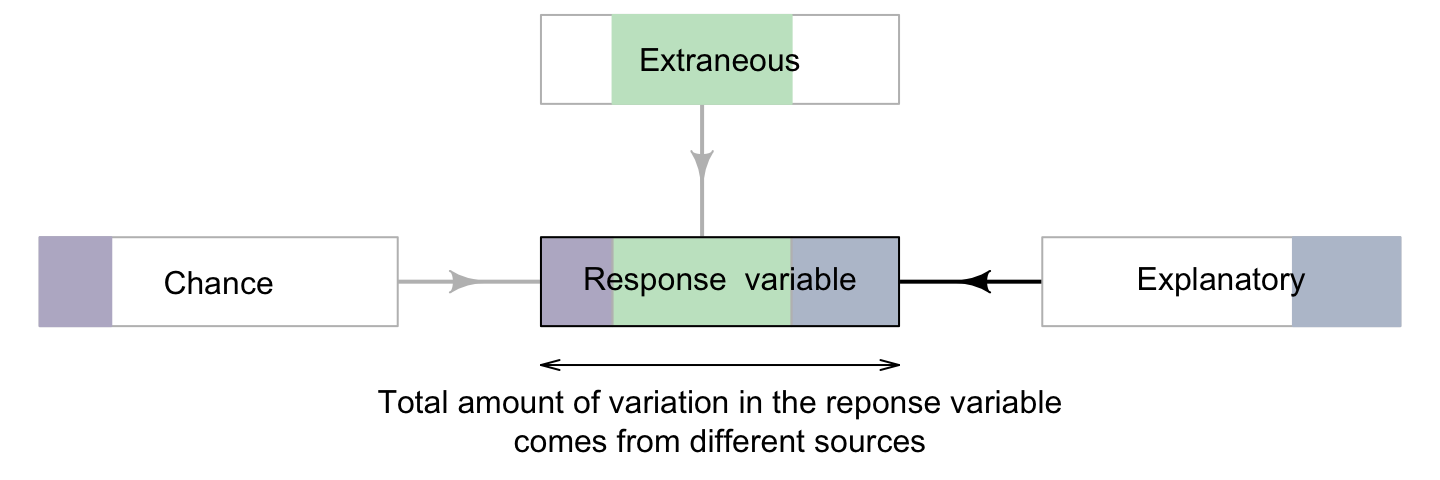
FIGURE 3.1: Other factors can influence the values of the response variable, besides the relationship of interest
The purpose of the study is to explore the relationship between the response variable and the explanatory variable... but other sources of variation can obscure that relationship. An internally valid study helps establish the relationship between the response and explanatory variables, and eliminates other explanations for the relationship as far as possible (Fig. 3.1).
Definition 3.3 (Research design) Research design refers to the decisions made by the researchers to maximise external validity and internal validity.
Internal validity is one of the most important properties of scientific studies, and is important for reasoning about evidence more generally. Designing studies to maximise internal validity is the focus of Chap. 7.
Data collection is often tedious, time consuming and expensive: you usually get one chance to collect data. In contrast, data can be analysed as many times as necessary. Design the study properly the first time!
3.3 The impact of changes in the explanatory variable
Changes in the values of the explanatory variable may be associated with changes in the values of the response variable. However, it may not; after all, determining if a relationship exists between the response and explanatory variables (or the extent of this relationship) is the purpose of the study. If nothing else influenced the values of the response variable, life would be easy: any change of a given size in the value of the explanatory variable would always result in a change of the same size in the value of the response variable.
Example 3.3 (Explanatory variable) In the typing-speed study (Sect. 3.2), the explanatory variable is the age group of the person. If nothing else influenced typing speed, every student under \(25\) record the same typing speed every time, and every student \(25\) or older would record the same typing speed every time. This is clearly unreasonable.
3.4 The impact of extraneous variables
Other variables (besides the explanatory variable) almost certainly exist which are associated with changes in the value of the response variable. These are called extraneous variables.
Definition 3.4 (Extraneous variable) An extraneous variable is any variable associated with the response variable, but is not the explanatory variable.
Example 3.4 In the typing-speed study (Example 3.1), potential extraneous variables may include age, the presence or absence of certain medical conditions, the level of familiarity with computers, whether the person wears glasses, etc.
All extraneous variables are, by definition, related to the response variable. They may or may not also be associated with the explanatory variable. Extraneous variables may have other names too (Fig. 3.4), though these names are used inconsistently in research.

Extraneous variable also related to the explanatory variable are called confounding variables (or a confounders); see Fig. 3.2 (left panel). A confounding variable can obscure the true relationship between the response and explanatory variables (i.e., confounding variables can bias the results).
Definition 3.5 (Confounding variable) A confounding variable (or a confounder) is an extraneous variable associated with the response and explanatory variables.
Definition 3.6 (Confounding) Confounding is when a third variable influences the observed relationship between the response and explanatory variable.
Confounding variables are associated with both the response and explanatory variables. This does not necessarily mean the value of the confounding variable causes changes in the variables.
Example 3.5 (Confounding variables and associations) Consider a study comparing the proportion of females and males wearing sunglasses while walking in a local park. To determine if the variable 'whether or not it is raining' is an extraneous variable, we ask:
- Is the wearing of sunglasses (the response variable) potentially different depending on whether or not it is raining?
The absence of rain may influence people to be more likely to wear sunglasses. Hence 'whether or not it is raining' is very likely an extraneous variable.
To determine if it is a confounding variable, we also ask:
- Is one sex (the explanatory variable) more likely to be walking in the park depending on whether or not it is raining?
We do not ask if the presence of rain changes the sex of the person; we ask if the presence of rain is associated with different proportions of males and females walking in the presence of rain. It may be the case (for example) that males are more likely to walk in the rain than females, so 'whether or not it is raining' may be an extraneous variable (but it is not obvious).
A relationship between the response and explanatory variables may be apparent, but only because both of these variables are associated with the confounding variable (Fig. 3.2).
Example 3.6 (Confounding variables) People who carry cigarette lighters are more likely to get lung cancer. The reason this relationship exists, however, is because of a confounding variable. 'Whether or not the person is a smoker' is probably associated with both the response and explanatory variables:
- A smoker is more likely to carry a cigarette lighter (the explanatory variable) than a non-smoker; and
- A smoker is more likely to develop lung cancer (the response variable) than a non-smoker.
Consider this RQ:
Among university students, is the percentage of females who know their own blood pressure the same as the percentage of males who know their own blood pressure?
For this RQ, the explanatory variable is the sex of person, and the response variable is whether a student knows their own blood pressure. A potential confounding variable is 'The program of study', since this is (potentially) related to both the response and explanatory variables:
- 'Program of study' is related to sex (the explanatory variable): a higher percentage of females study nursing, while a greater percentage of males study engineering (at least, in Australia).
- 'Program of study' is related to knowing your blood pressure (the response variable): nursing students probably practice taking each others blood pressures so probably know theirs, whereas engineering students do not.
Managing confounding is very important, as ignoring confounding can completely change the relationship between the response and explanatory variables (see Sect. 13.6) and hence can compromise internal validity. Managing confounding is discussed in Sect. 7.2.
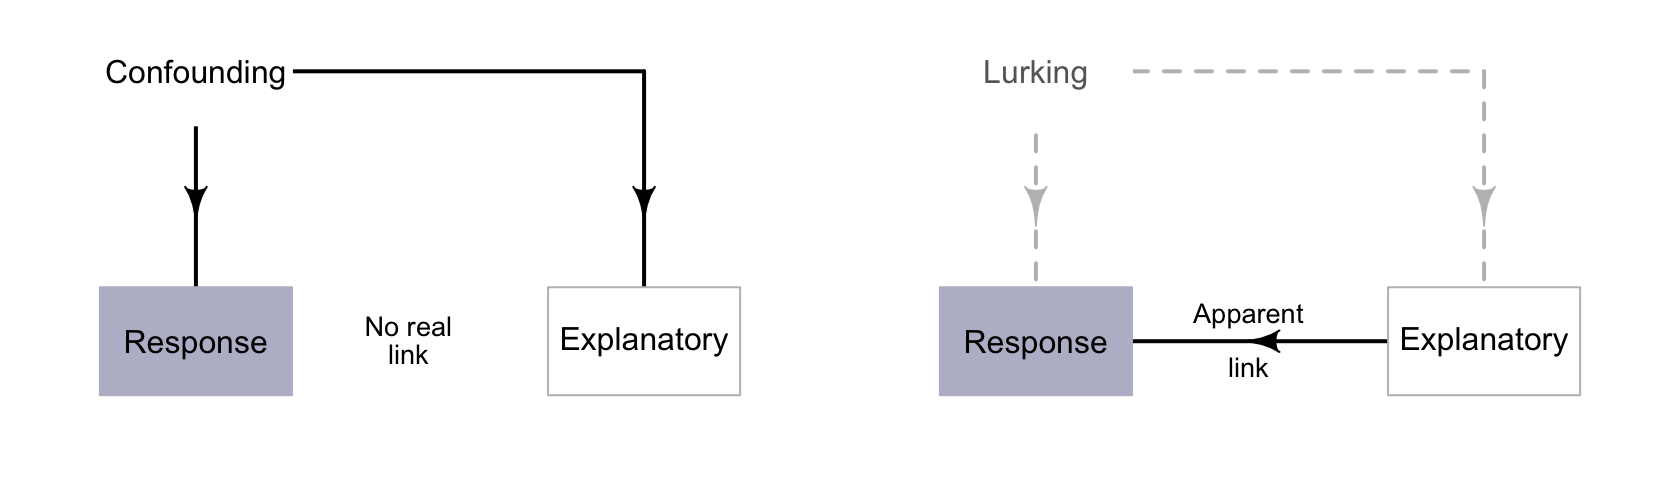
FIGURE 3.2: Confounding variables (left) are extraneous variables associated with the response and explanatory variables. Lurking variables (right) are associated with the response and explanatory variables, but are not recorded
If the values of potential confounding variables are recorded, their impact can be managed. However, sometimes the values of the confounding variables are not recorded (perhaps due to poor design); then, they are called lurking variables (Fig. 3.2, right panel). Lurking variables can lead to wrong conclusions (for example, see Sect. 13.6).
Definition 3.7 (Lurking variable) A lurking variable is an extraneous variable associated with the response and explanatory variables (that is, is a confounding variable), but whose values are not recorded in the study data.
Example 3.7 (Lurking variables) A study (Joiner (1981); Wilson Jr (1952)) examined the strength of plastic parts, to determine if the time in the production mould influenced the strength of the part (p. 55--56):
Hot plastic was introduced in the mold, pressed for \(10\) seconds, and removed. Another batch was then introduced into the same mold, pressed for \(20\) seconds, and so on, the time increasing with each batch.
Greater time in the mould (explanatory variable) was found to be associated with greater plastic strength (response variable). However, mould temperature was a lurking variable: it was associated with both the response and explanatory variables:
- Higher mould temperatures (the lurking variable) were associated with greater strength (the response variable); and
- Higher mould temperatures (the lurking variable) were experienced by later batches with longer mould times (the explanatory variable), since the mould was hotter for the later batches.
The cause of the greater strength was not the time in the mould; it was the higher temperature experienced by the later moulds (Fig. 3.3).
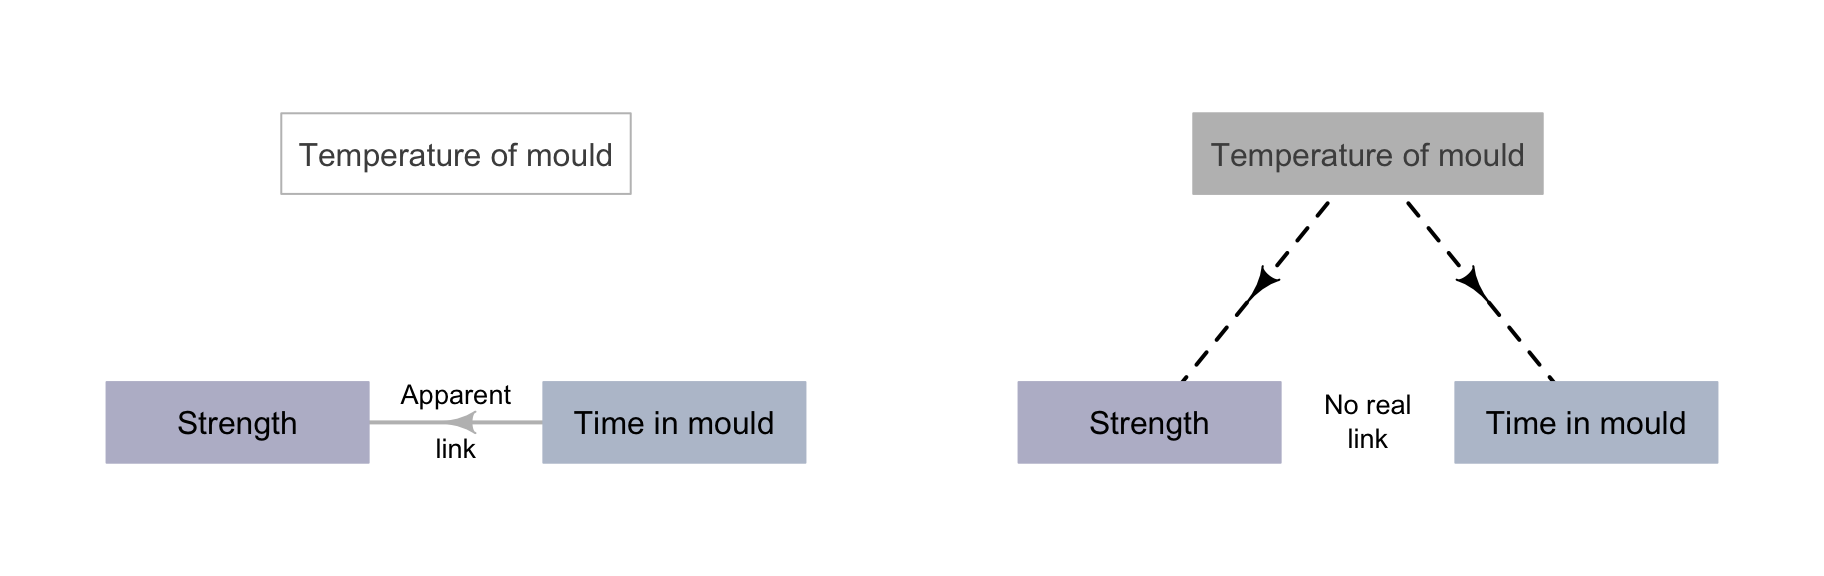
FIGURE 3.3: An example of a lurking variable. Left: the relationship as originally understood. Right: the relationship after the lurking variable was eventually exposed.
To clarify the language (Fig. 3.4):
- Extraneous variables are, by definition, always associated with the response variable. If they are not recorded, and so the researchers are unaware of them, they become part of unexplained chance.
- Extraneous variables are called confounding variables if they are also related to the explanatory variable.
- Confounding variables are called lurking variables, if they are not recorded.
These terms are not always used consistently by all researchers, but the ideas are important nonetheless.
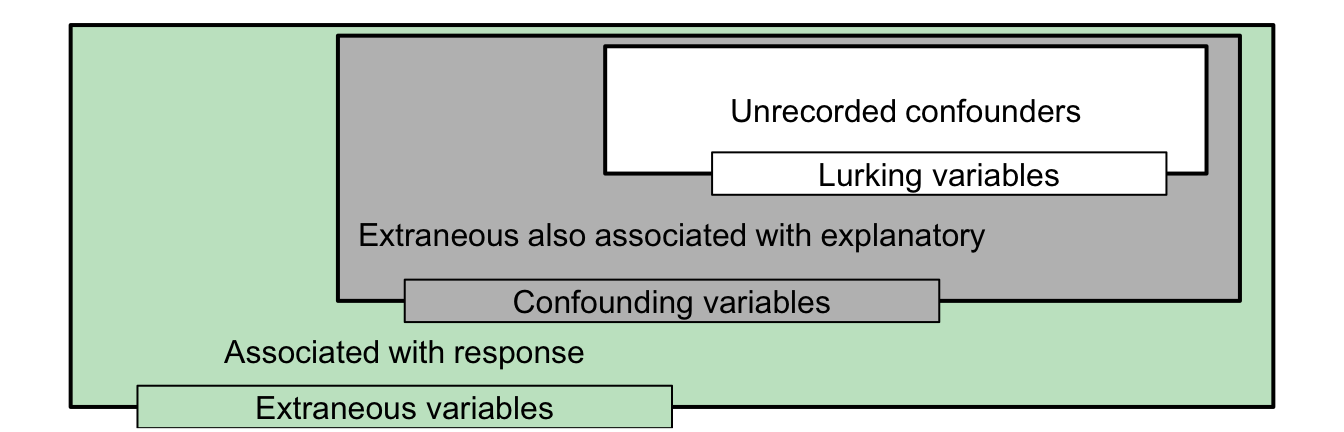
FIGURE 3.4: The relationships between extraneous, confounding and lurking variables
To avoid lurking variables, researchers generally collect lots of information about the individuals in the study (such as age and sex if the study involves people) and circumstances of the individuals in the study (such as the temperature at the time of data collection) that may be relevant, in case they are confounding variables.
Example 3.8 (Low internal validity) L. M. Larson et al. (2021) reviewed numerous studies that used double-fortified salt to manage iodine and iron deficiencies. They concluded that the internal validity of studies was 'generally weak' (p. 265) due, in part, to 'unaccounted confounders' (i.e., lurking variables).
3.5 The impact of chance
Chance variation (or natural variation) refers to variation that cannot otherwise be explained: even repeating a study exactly the same way every time on the same individuals will not always produce the same values of the response variable.
Chance variation makes the influence of the explanatory variable (which we want to study) hard to detect, so minimising chance variation is important. Minimising the amount of the chance variation requires using good design principles, and measuring as many other extraneous variables that may explain variation in the response variable as is reasonable.
Chance can impact the values of the response variable in different ways:
- Each individual can produce different values of the response variable each time the response variable is measured (within-individuals variation); and
- Each individual in the study can produce different values of the response variable compared to other individuals (between-individuals variation):
We need different strategies to understand each of these sources of variation:
- To estimate the amount of variation within individuals: multiple observations are needed from each unit of analysis (individual).
- To estimate amount of variation between individuals: multiple units of analysis (individuals) are needed.
Example 3.9 (Three ways to sample) Consider the typing-speed study (Example 3.1) again, and these three sampling situations:
- Using one female \(30\) times would tell us a lot about that female... but very little about females in general.
- Using \(30\) different females once each would tell us a lot about females in general... but we have one measurement from each. Since we might expect that the same person might produce similar (not necessarily identical) typing speeds, this is not really a problem.
- Using \(10\) different females, three times each, would tell us a lot about females in general... and a little about each female too.
3.6 Chapter summary
Research questions are about populations, but samples are studied in practice. Studies that use a sample that represents the population of interest are called externally valid.
In a research study, the main interest is usually the relationship between a response variable and explanatory variable. Well-designed studies that allow the researchers to focus on this relationship have good internally validity. Such studies eliminate, or account for, other explanations for the variation in the values of the response variable.
However the values of the response variable can be influenced by things other than the explanatory variable: extraneous variable (other variables that aren't of primary interest), and chance.
Some extraneous variables are also related to the explanatory variable, and are called confounding variables (and are lurking variables if not recorded). If the research design makes it difficult to separate the relationship between the response and explanatory variable from other possible causes, the study has poor internal validity.
3.7 Quick review questions
Martnes and Bere (2023) (p. 1) compared the
...time spent riding and exercise intensity when... riding an electric-assisted bicycle with cargo (\(30\) kg) and without cargo...
In their study, they recorded the age, height, weight, and resting metabolic rate of all subjects who completed the \(4.5\) km ride. Subjects were allocated by the researchers to ride both with and without cargo.
Are the following statements true or false?
- The explanatory variable is the age of the subjects.
- The height of the subjects is a lurking variable.
- The explanatory variable is whether the electric-assisted bike is ridden with or without cargo.
- Weight is an extraneous variable.
- One response variable is the time to complete the journey.
- Age is a possible confounding variable. Explain.
- Resting metabolic rate is a possible confounding variable. Explain.
3.8 Exercises
Answers to odd-numbered exercises are available in App. E.
Exercise 3.1 The Giant Mine in Yellowknife, Canada, ceased operation in 1999 after \(50\) years, during which \(237\ 000\) tonnes of arsenic trioxide was released. One study (Houben et al. 2016) examined the arsenic concentration in \(25\) lakes within a \(25\) km radius of the mine (\(11\) years after the mine closed), to determine if the arsenic concentration was related to the distance of the lake from the mine. They also recorded:
- the type of bedrock (volcanic; sedimentary; grandiorite);
- the ecology type (lowland; upland);
- the elevation of the lake (in metres);
- the lake area (in hectares); and
- the catchment area (in hectares).
Use this information to answer the following.
- What is the response variable?
- What is the explanatory variable?
- Is the variable 'Catchment area' likely to be a lurking variable?
- Is the variable 'Type of bedrock' likely to be a confounding variable?
- What is the best description of the variable 'Ecology type'?
Exercise 3.2 A study examined the relationship between diet quality and depression in Australian adolescents (Jacka et al. 2010). The researchers used a sample of \(7114\) adolescents aged \(10\)--\(14\) years old, and also measured information about (p. 435):
...age, gender, socioeconomic status, parental education, parental work status, family conflict, poor family management, dieting behaviours, body mass index, physical activity, and smoking...
- Identify the response and explanatory variables.
- Which of the other listed variable reasonably could be considered extraneous variables, confounding variables and lurking variables?
Exercise 3.3 A newspaper article (Anonymous 2012) reported that 'Women who drank green tea at least three times a week were \(14\) per cent less likely to develop a cancer of the digestive system'. However, the final paragraph of the article notes that:
Nobody can say whether green tea itself is the reason, since green tea lovers are often more health-conscious in general.
Identify the explanatory and response variables, and explain that final sentence using language introduced in this chapter.
Exercise 3.4 A study recorded the lung capacity (using Forced Expiratory Volume, or FEV, in litres) of children aged \(3\) to \(19\) (Tager et al. 1979; Kahn 2005), and also recorded whether not the children were smokers. One finding was that children who smoke have a larger average FEV (i.e., larger average lung capacity) than children who do not smoke, in general.
Name a confounding variable that may explain this surprising finding. Would it be likely that this variable is a lurking variable?
Exercise 3.5 Consider a study to determine if the percentage of children who consume Ready-To-Eat-Cereals (RTEC) for breakfast is the same for children aged between \(5\) and \(10\), as for children aged between \(11\) and \(15\). The researchers also measured the age of the child, the number of siblings living with the child, and the sex of the child.
- Which of these variables are extraneous variables?
- The sex of the child
- The percentage consuming RTEC
- Whether or not the child consumes RTEC
- The age group of the child
- The age of the child
- The number of siblings living with the child
- Is the variable 'the sex of the child' a lurking variable?
- Is it reasonable to consider the weight of the child as a lurking variable?