第 53 章 双样本t检验
本章需要的宏包,希望大家提前安装
install.packages(c("bayesplot", "palmerpenguins", "rstatix", "broom", "ggstatsplot", "infer", "ggthemes"))53.1 实验设计
研究某种药物的疗效,一般采用大样本随机双盲对照试验,比较在特定条件下被试的反应,获取相关数据后,会进行组内比较或者组间比较:
组内比较, 同一组人,每个人要完成多次测量(重复测量),比如服药第一天的情况,服药第二天的情况,服药第三天的情况…,每组的人数是恒定的。
组间比较,
A组的被试吃1mg,B组被试吃2mg,C组吃3mg…,每组的人数不要求是恒定的。
这个过程可能会使用two sample t-tests。
53.2 提问
我们以企鹅体征数据作为案例,假定企鹅就是我们的被试
library(tidyverse)
theme_set(bayesplot::theme_default())

penguins <- palmerpenguins::penguins %>%
  drop_na()
提出问题:
企鹅有男女两种性别(
female, male),不同性别的bill_length_mm的均值是否相同?企鹅种类有三种(
Adelie, Chinstrap, Gentoo),比较在每个种类下男企鹅和女企鹅bill_length_mm的均值?两两比较不同种类的
bill_length_mm的均值?
53.2.1 不同性别的嘴峰长度的均值是否相同
强烈推荐大家先可视化探索
penguins %>%
  ggplot(aes(x = sex, y = bill_length_mm)) +
  geom_boxplot() +
  geom_jitter() +
  theme(legend.position = "none")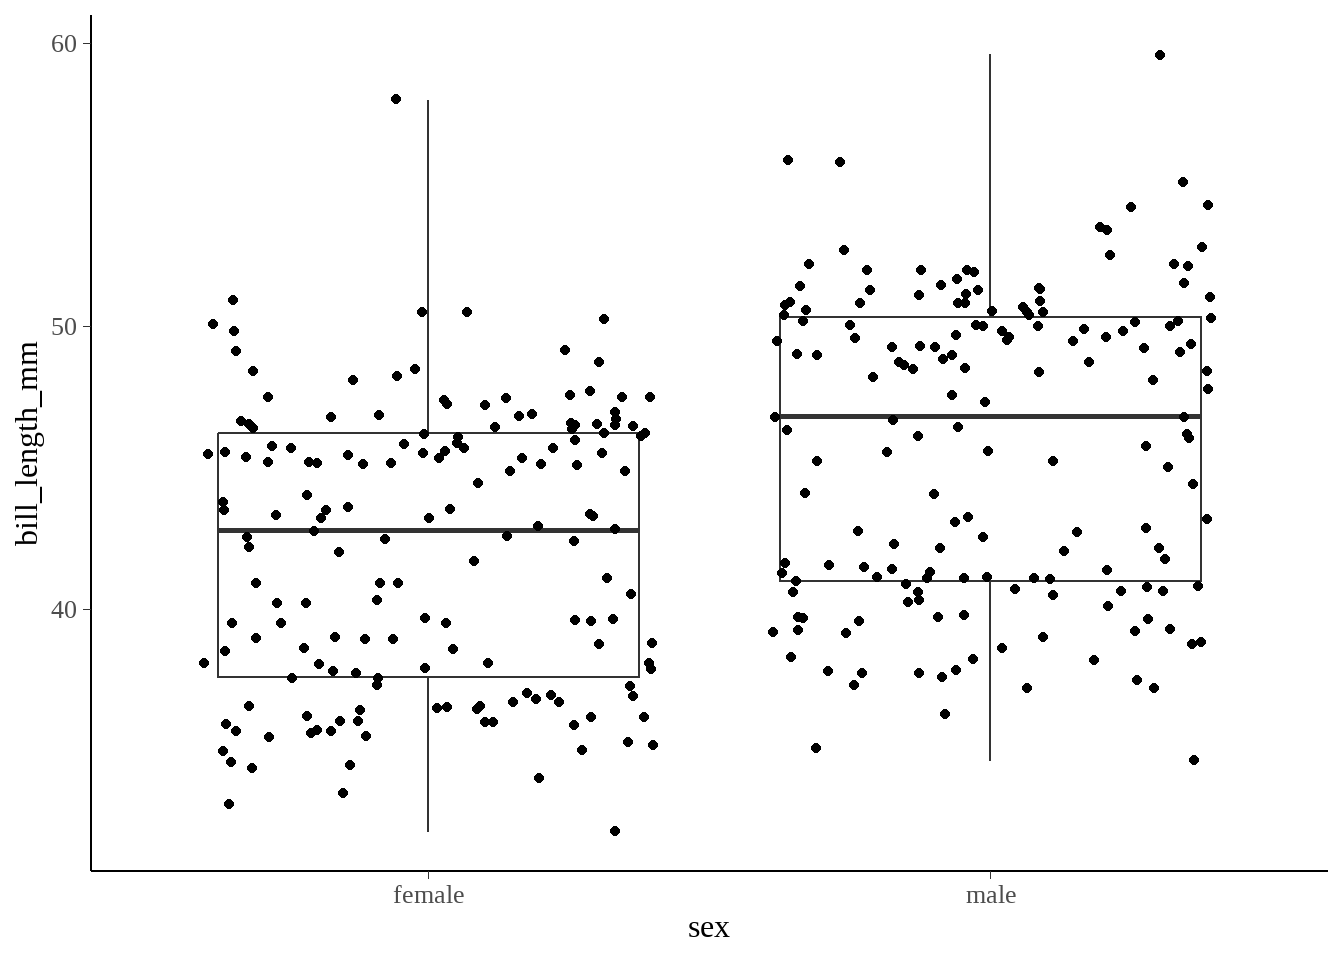
接着简单计算,不同性别bill_length_mm均值以及差值
penguins %>%
  group_by(sex) %>%
  summarize(avg_rating = mean(bill_length_mm, na.rm = TRUE)) %>%
  mutate(diff_means = avg_rating - lag(avg_rating))
## # A tibble: 2 × 3
## sex avg_rating diff_means
## <fct> <dbl> <dbl>
## 1 female 42.1 NA
## 2 male 45.9 3.76
53.2.1.1 using t.test()
t.test(
  bill_length_mm ~ sex,
  data = penguins,
  var.equal = TRUE    # `var.equal = ` 假定两个样本方差是否相等
)
##
## Two Sample t-test
##
## data: bill_length_mm by sex
## t = -6.667, df = 331, p-value = 1.094e-10
## alternative hypothesis: true difference in means between group female and group male is not equal to 0
## 95 percent confidence interval:
## -4.866557 -2.649027
## sample estimates:
## mean in group female mean in group male
## 42.09697 45.85476## # A tibble: 1 × 10
## estimate estimate1 estimate2 statistic p.value parameter conf.low conf.high
## <dbl> <dbl> <dbl> <dbl> <dbl> <dbl> <dbl> <dbl>
## 1 -3.76 42.1 45.9 -6.67 1.09e-10 331 -4.87 -2.65
## # ℹ 2 more variables: method <chr>, alternative <chr>
53.2.1.2 using rstatix::t_test()
rstatix宏包提供了类似dplyr风格的语法
## # A tibble: 1 × 8
##   .y.            group1 group2    n1    n2 statistic    df        p
## * <chr>          <chr>  <chr>  <int> <int>     <dbl> <dbl>    <dbl>
## 1 bill_length_mm female male     165   168     -6.67   331 1.09e-10
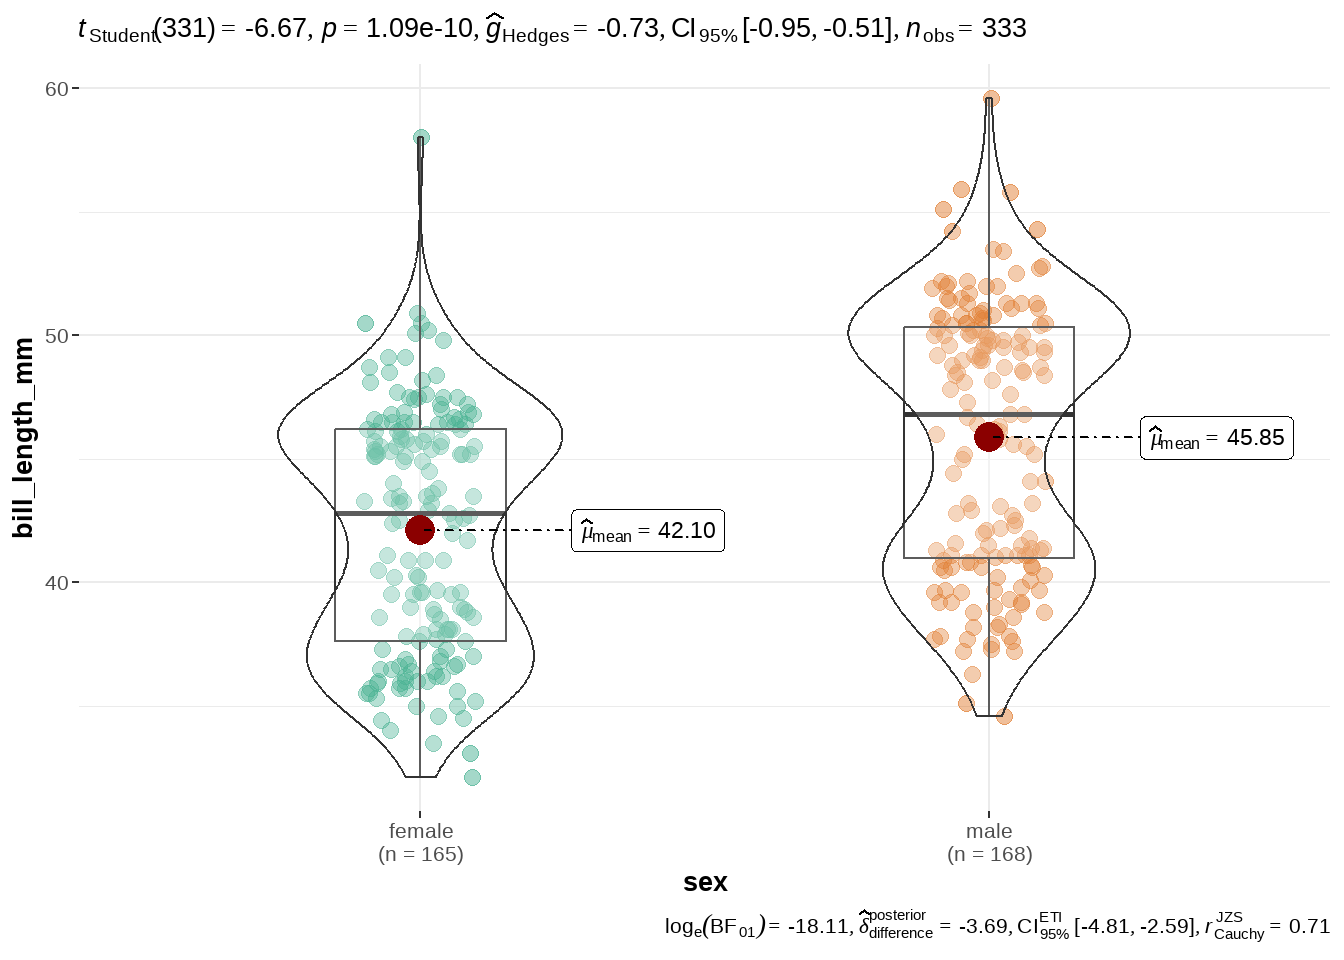
53.2.1.3 using ggstatsplot::ggbetweenstats()
探索性数据分析,将包含数据可视化和统计建模两个阶段,可视化为建模提供依据,模型反过来又可以提出不同的可视化方法。ggstatsplot将这两个阶段统一在图形中,即绘制带有统计检验信息的图形,提高数据探索的速度和效率。
library(ggstatsplot)

penguins %>%
  ggbetweenstats(
    x = sex,
    y = bill_length_mm,
    pairwise.comparisons = TRUE,
    pairwise.display = "all",
    var.equal = TRUE
  )
53.2.1.4 using infer: 基于模拟的检验
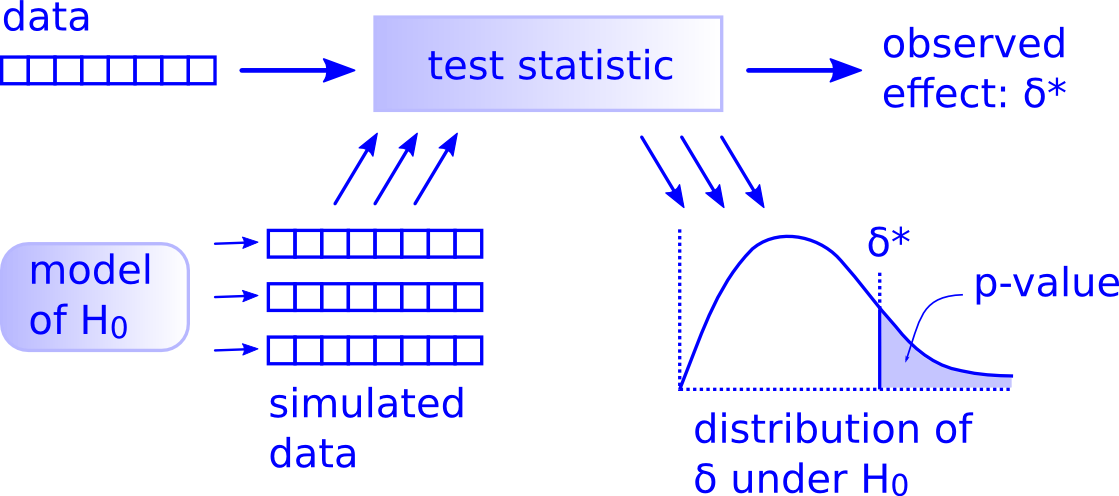
图 53.1: Hypothesis Testing Framework
- 实际观察的差别
library(infer)
obs_diff <- penguins %>%
  specify(formula = bill_length_mm ~ sex) %>%
  calculate(
    stat = "diff in means",
    order = c("male", "female")
  )
obs_diff
## Response: bill_length_mm (numeric)
## Explanatory: sex (factor)
## # A tibble: 1 × 1
## stat
## <dbl>
## 1 3.76- 模拟
null_dist <- penguins %>%
  specify(formula = bill_length_mm ~ sex) %>%
  hypothesize(null = "independence") %>%
  generate(reps = 5000, type = "permute") %>%
  calculate(
    stat = "diff in means",
    order = c("male", "female")
  )
head(null_dist)
## Response: bill_length_mm (numeric)
## Explanatory: sex (factor)
## Null Hypothesis: independence
## # A tibble: 6 × 2
## replicate stat
## <int> <dbl>
## 1 1 0.535
## 2 2 -0.655
## 3 3 -0.285
## 4 4 0.648
## 5 5 -0.175
## 6 6 0.675specify()指定解释变量和被解释变量 (y ~ x)hypothesize()指定零假设 (比如,independence=y和x彼此独立)-
generate()从基于零假设的平行世界中抽样:-
reps,指定抽样次数 -
type,指定重抽样的类型。
-
calculate()计算每次抽样的统计值 (stat = "diff in means")
- 可视化
null_dist %>%
  visualize() +
  shade_p_value(obs_stat = obs_diff, direction = "both")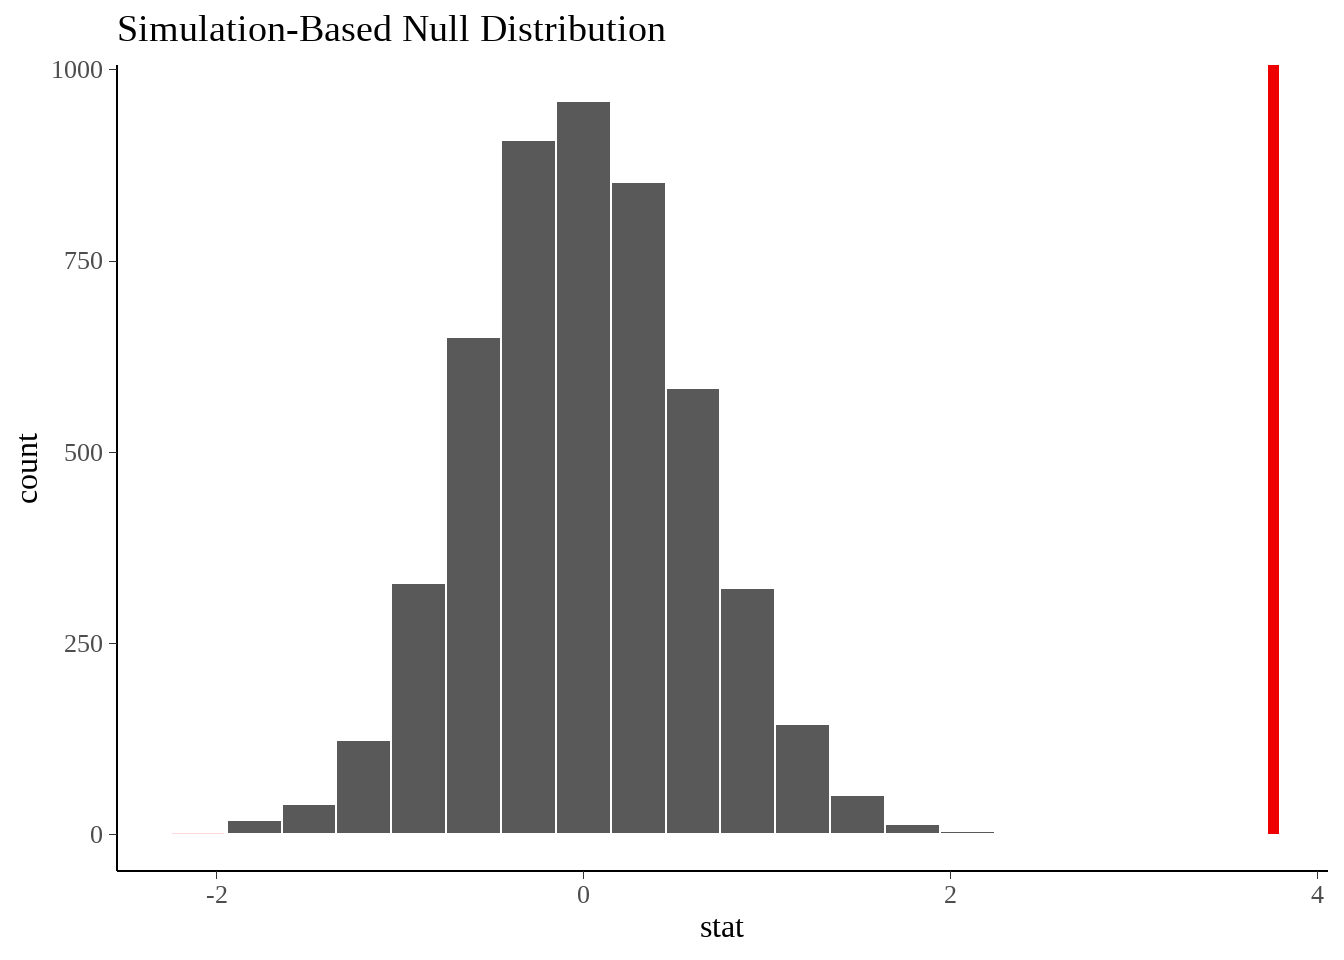
- 计算p值
pvalue <- null_dist %>%
  get_pvalue(obs_stat = obs_diff, direction = "two_sided")

pvalue
## # A tibble: 1 × 1
## p_value
## <dbl>
## 1 0
53.2.1.5 using lm()
## # A tibble: 2 × 5
##   term        estimate std.error statistic   p.value
##   <chr>          <dbl>     <dbl>     <dbl>     <dbl>
## 1 (Intercept)    42.1      0.400    105.   2.18e-256
## 2 sexmale 3.76 0.564 6.67 1.09e- 10confint(model)## 2.5 % 97.5 %
## (Intercept) 41.309431 42.884509
## sexmale 2.649027 4.866557可以看到,95%的置信区间与用t.test()的结果完全一样。
53.2.2 每个种类下男企鹅和女企鹅bill_length_mm的均值
企鹅种类有三种,比较在每个种类下男企鹅和女企鹅bill_length_mm的均值?意思是多次t-test
penguins %>%
  ggplot(aes(x = species, y = bill_length_mm, color = sex)) +
  geom_boxplot(position = position_dodge(0.8)) +
  geom_jitter(
    position = position_jitterdodge()
  ) +
  scale_x_discrete(
    expand = expansion(mult = c(0.3, 0.3))
  ) +
  theme(legend.position = "none")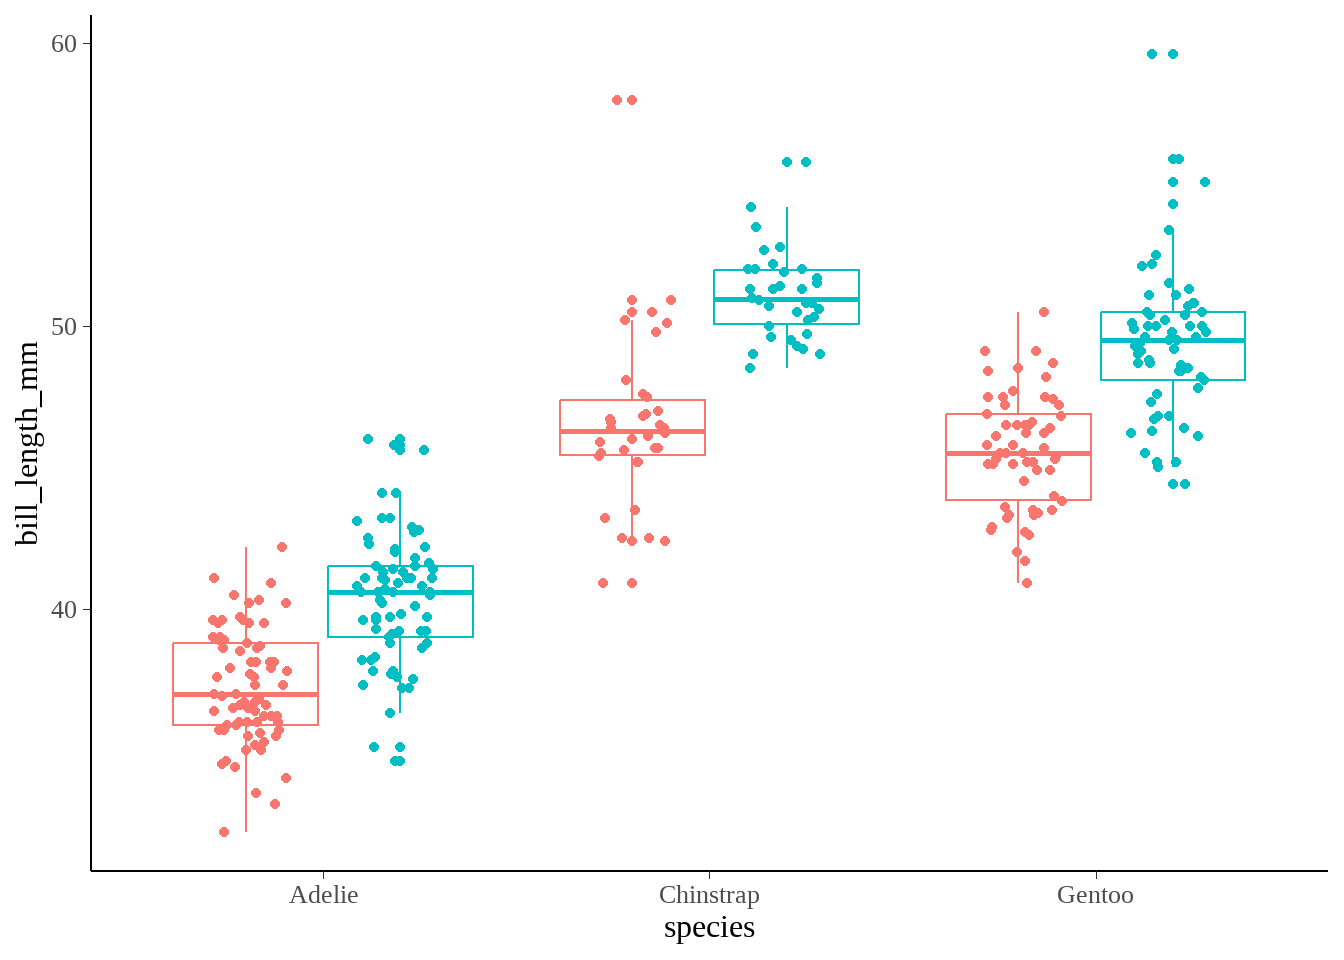
53.2.2.1 using group_modify() + t.test()
penguins %>%
  group_by(species) %>%
  group_modify(
    ~ t.test(bill_length_mm ~ sex, data = .x, var.equal = TRUE) %>%
      broom::tidy()
  )
## # A tibble: 3 × 11
## # Groups: species [3]
## species estimate estimate1 estimate2 statistic p.value parameter conf.low
## <fct> <dbl> <dbl> <dbl> <dbl> <dbl> <dbl> <dbl>
## 1 Adelie -3.13 37.3 40.4 -8.78 4.44e-15 144 -3.84
## 2 Chinstrap -4.52 46.6 51.1 -7.57 1.53e-10 66 -5.71
## 3 Gentoo -3.91 45.6 49.5 -8.82 1.30e-14 117 -4.79
## # ℹ 3 more variables: conf.high <dbl>, method <chr>, alternative <chr>
53.2.2.2 using rstatix::t_test()
library(rstatix)

penguins %>%
  group_by(species) %>%
  rstatix::t_test(bill_length_mm ~ sex, var.equal = TRUE)
## # A tibble: 3 × 9
## species .y. group1 group2 n1 n2 statistic df p
## * <fct> <chr> <chr> <chr> <int> <int> <dbl> <dbl> <dbl>
## 1 Adelie bill_length_mm female male 73 73 -8.78 144 4.44e-15
## 2 Chinstrap bill_length_mm female male 34 34 -7.57 66 1.53e-10
## 3 Gentoo bill_length_mm female male 58 61 -8.82 117 1.3 e-14
53.2.2.3 using ggstatsplot::grouped_ggbetweenstats()
library(ggstatsplot)

penguins %>%
  grouped_ggbetweenstats(
    x = sex,
    y = bill_length_mm,
    pairwise.comparisons = TRUE,
    pairwise.display = "all",
    var.equal = TRUE,
    grouping.var = species  # group
  )
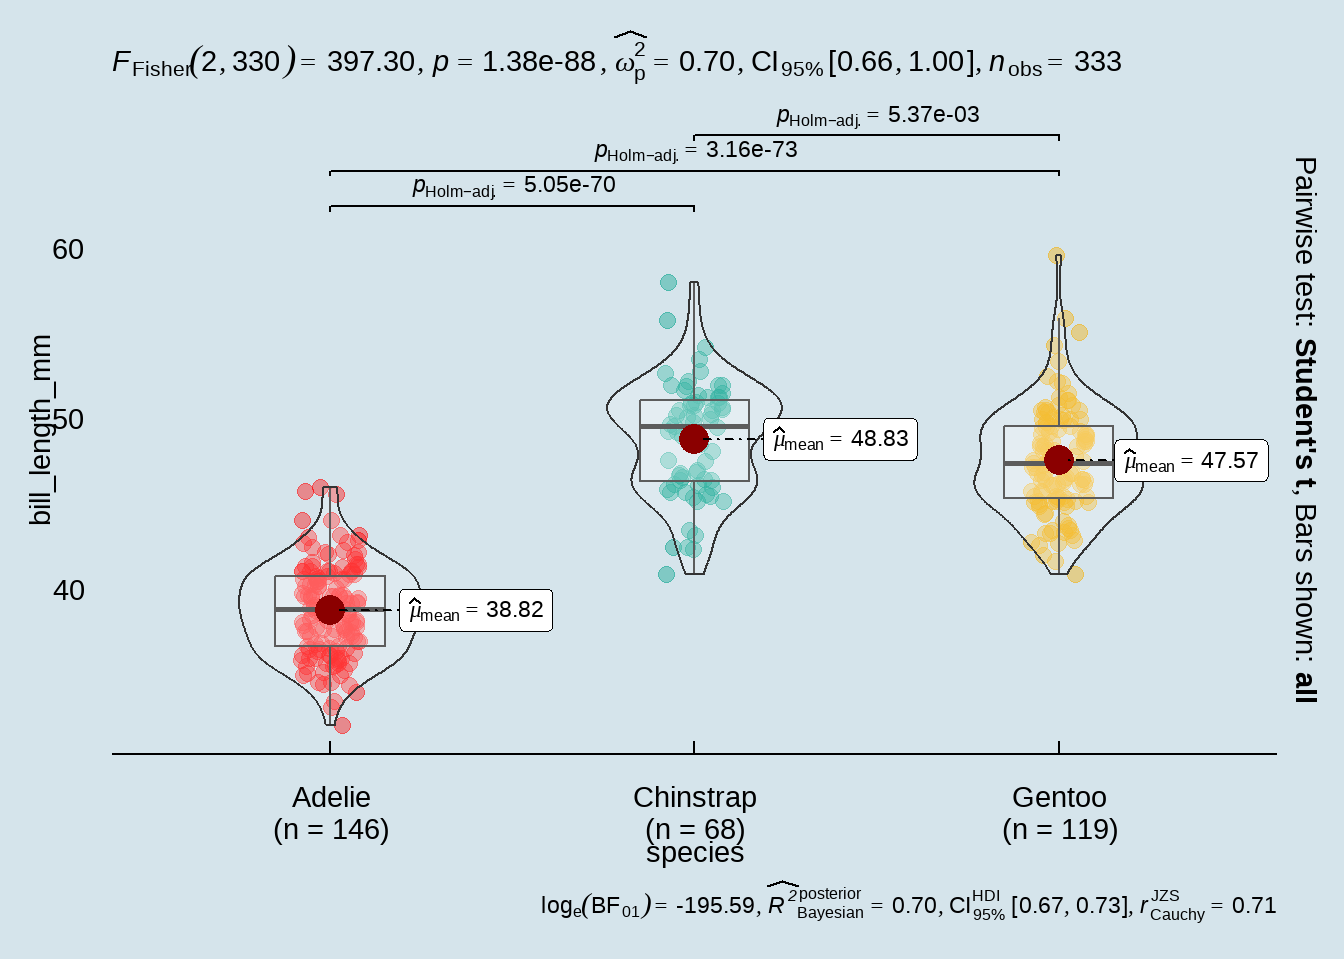
53.2.3 两两比较不同种类的bill_length_mm的均值
企鹅种类有三种,两两比较不同种类的bill_length_mm的均值。
Adelie - ChinstrapAdelie - GentooChinstrap - Gentoo
t.test(bill_length_mm ~ species, data = penguins) ## Error in t.test.formula(bill_length_mm ~ species, data = penguins): grouping factor must have exactly 2 levelsspecies 有三组,也就说有三个层级,程序不接受。方法是:成对pairwise t-tests
53.2.3.1 using pairwise.t.test()
pairwise.t.test(x, y) # x is a vector of the data, y is the group factorpairwise.t.test(
penguins$bill_length_mm, penguins$species,
alternative = "two.sided",
paired = FALSE,
p.adj = "holm"
) %>%
broom::tidy()## # A tibble: 3 × 3
## group1 group2 p.value
## <chr> <chr> <dbl>
## 1 Chinstrap Adelie 5.05e-70
## 2 Gentoo Adelie 3.16e-73
## 3 Gentoo Chinstrap 5.37e- 3注意:pairwise t-tests并不是简单地把每一个可能的配对都做一次t-test
penguins %>%
  filter(species %in% c("Gentoo", "Chinstrap")) %>%
  t.test(bill_length_mm ~ species, data = .) %>%
  broom::tidy()
## # A tibble: 1 × 10
## estimate estimate1 estimate2 statistic p.value parameter conf.low conf.high
## <dbl> <dbl> <dbl> <dbl> <dbl> <dbl> <dbl> <dbl>
## 1 1.27 48.8 47.6 2.56 0.0117 131. 0.286 2.25
## # ℹ 2 more variables: method <chr>, alternative <chr>
53.2.3.2 using rstatix::pairwise_t_test()
library(rstatix)

penguins %>%
  pairwise_t_test(
    bill_length_mm ~ species,
    p.adjust.method = "holm",
    alternative = "two.sided",
    paired = FALSE
  )
## # A tibble: 3 × 9
## .y. group1 group2 n1 n2 p p.signif p.adj p.adj.signif
## * <chr> <chr> <chr> <int> <int> <dbl> <chr> <dbl> <chr>
## 1 bill_length… Adelie Chins… 146 68 2.52e-70 **** 5.05e-70 ****
## 2 bill_length… Adelie Gentoo 146 119 1.05e-73 **** 3.16e-73 ****
## 3 bill_length… Chins… Gentoo 68 119 5.37e- 3 ** 5.37e- 3 **
53.2.3.3 using ggstatsplot::ggbetweenstats()
penguins %>%
  ggstatsplot::ggbetweenstats(
    x = species,
    y = bill_length_mm,
    pairwise.comparisons = TRUE,
    pairwise.display = "all",
    p.adjust.method = "holm",
    messages = FALSE,
    var.equal = TRUE,
    alternative = "two.sided",
    ggtheme = ggthemes::theme_economist(),
    package = "wesanderson",
    palette = "Darjeeling1"
  )