第 25 章 ggplot2之图例系统
这一章,我们一起学习ggplot2中的图例系统,内容相对简单,但还是推荐大家阅读ggplot2官方文档
25.1 图例系统
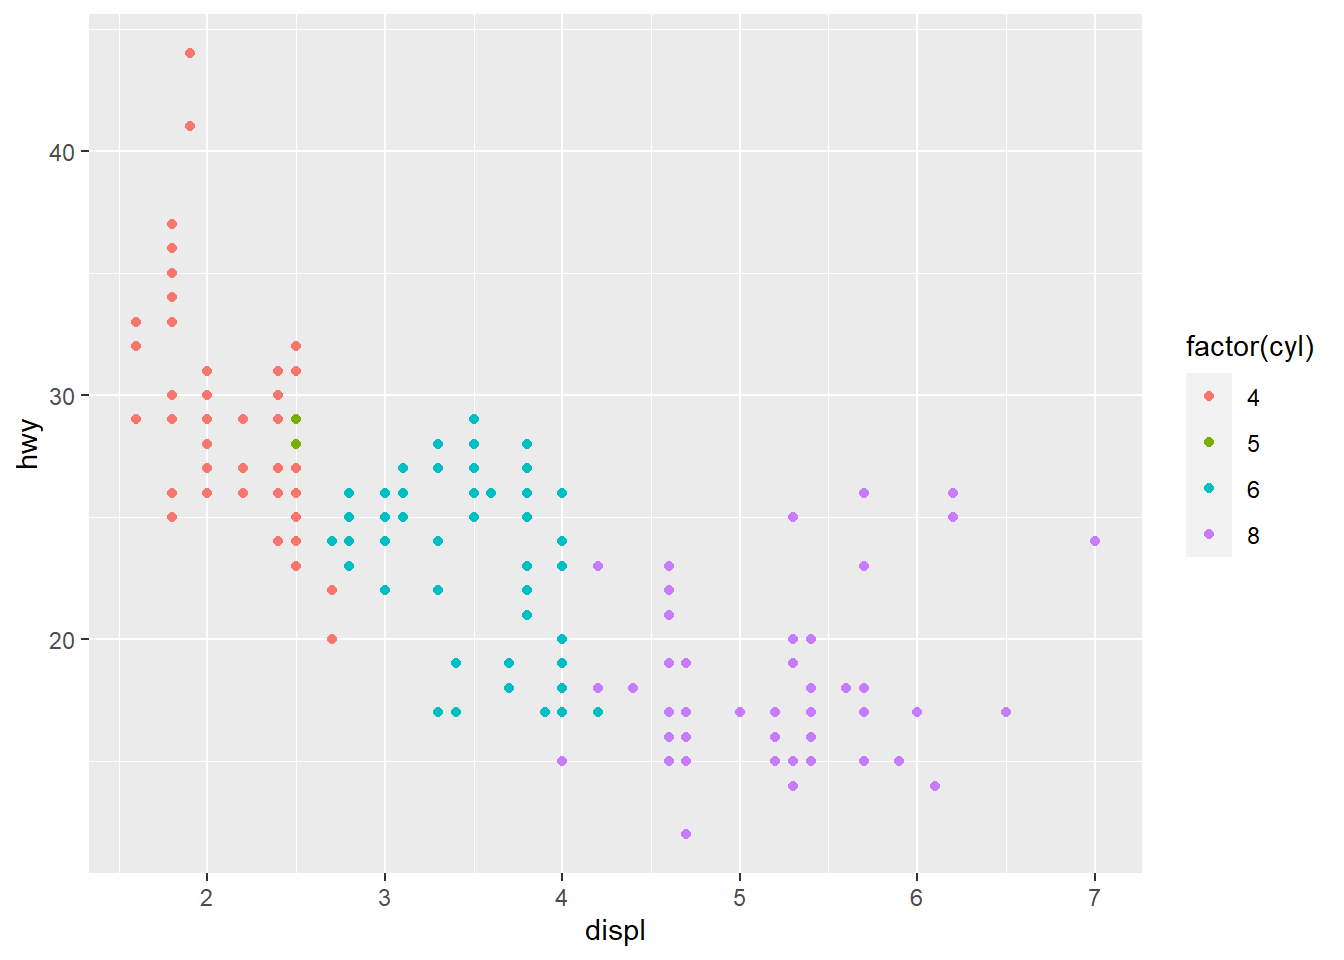
为了方便演示,我们还是用熟悉的配方ggplot2::mpg
如果想调整图例的样式,可以使用guides()函数,用法类似上节课中的theme函数, 具体参数为:
- 要么是
字符串(i.e."color = colorbar"or"color = legend"), - 要么是
特定的函数(i.e.color = guide_colourbar()orcolor = guide_legend())
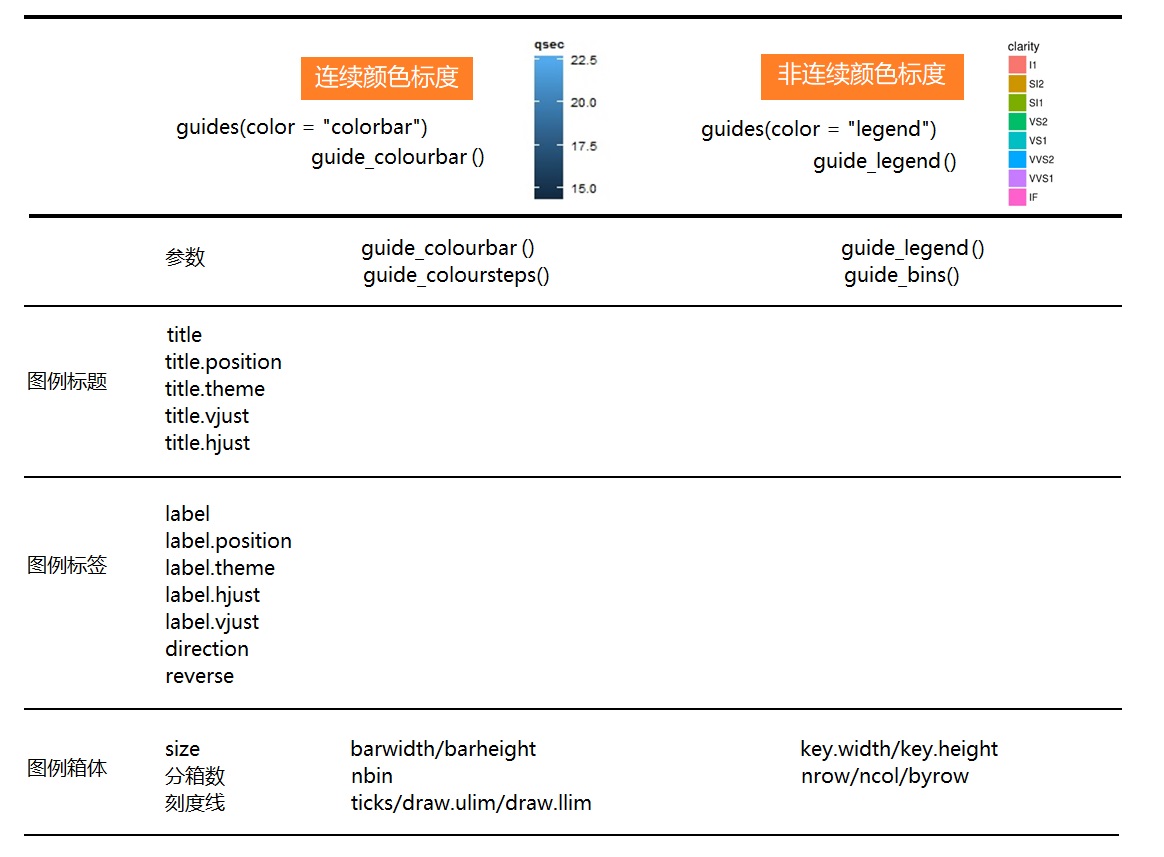
以下 guides() 函数族用于控制图例的外观
-
guide_colorbar(): continuous colors -
guide_legend(): discrete values (shapes, colors) -
guide_axis(): control axis text/spacing, add a secondary axis -
guide_bins(): creates “bins” of values in the legend -
guide_colorsteps(): makes colorbar discrete
knitr::include_graphics("images/img/guides_examples.png")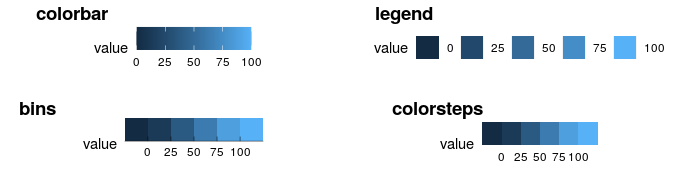
25.2 案例详解
mpg %>%
  ggplot(aes(x = displ, y = hwy, color = factor(cyl))) +
  geom_point() +
  ggtitle("This is my title") +
  labs(x = "x_displ", y = "y_hwy") +
  guides(color = "legend")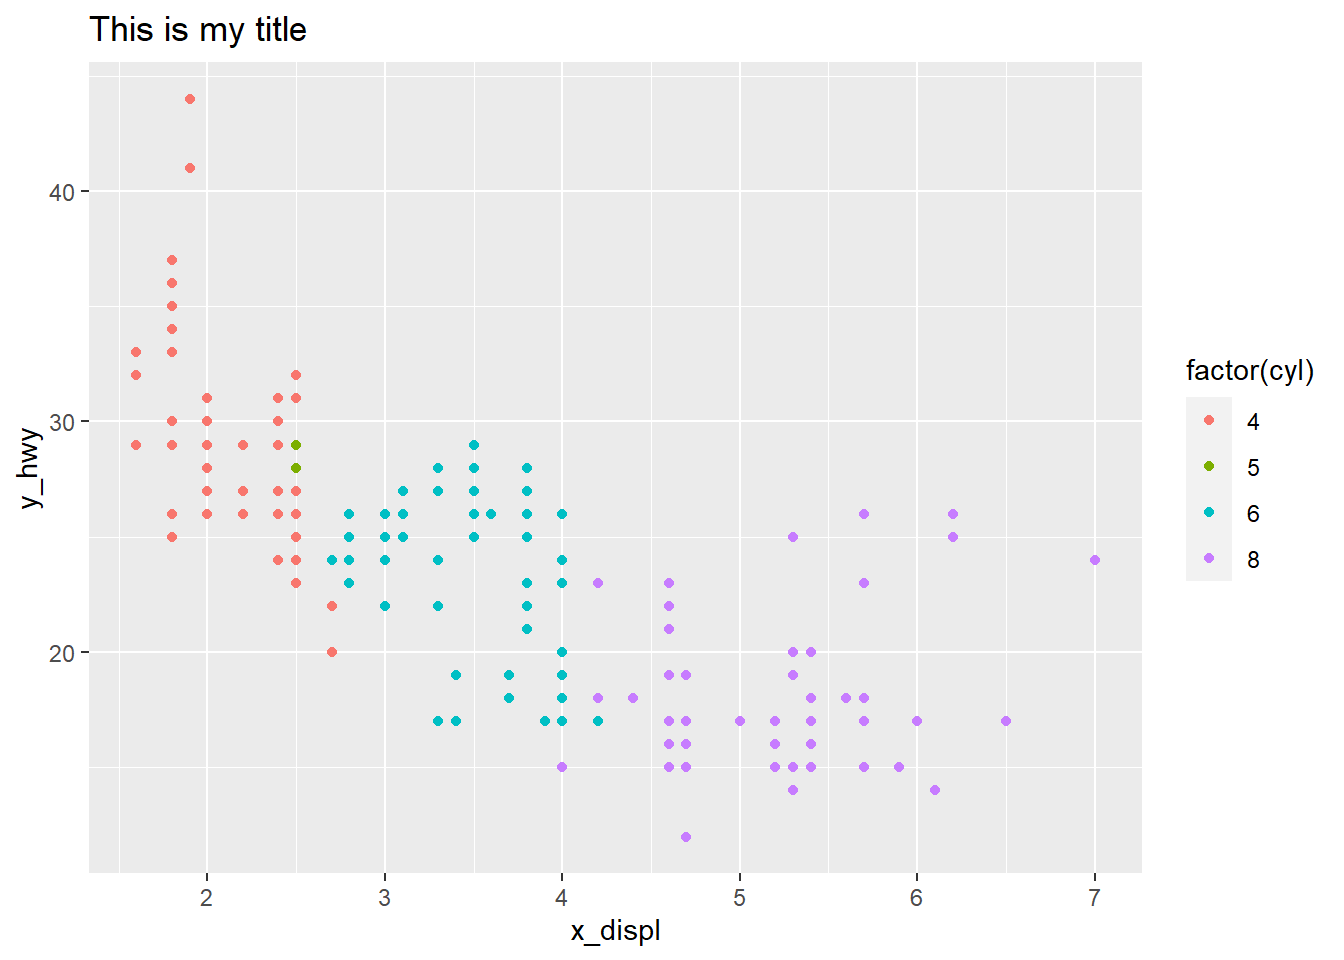
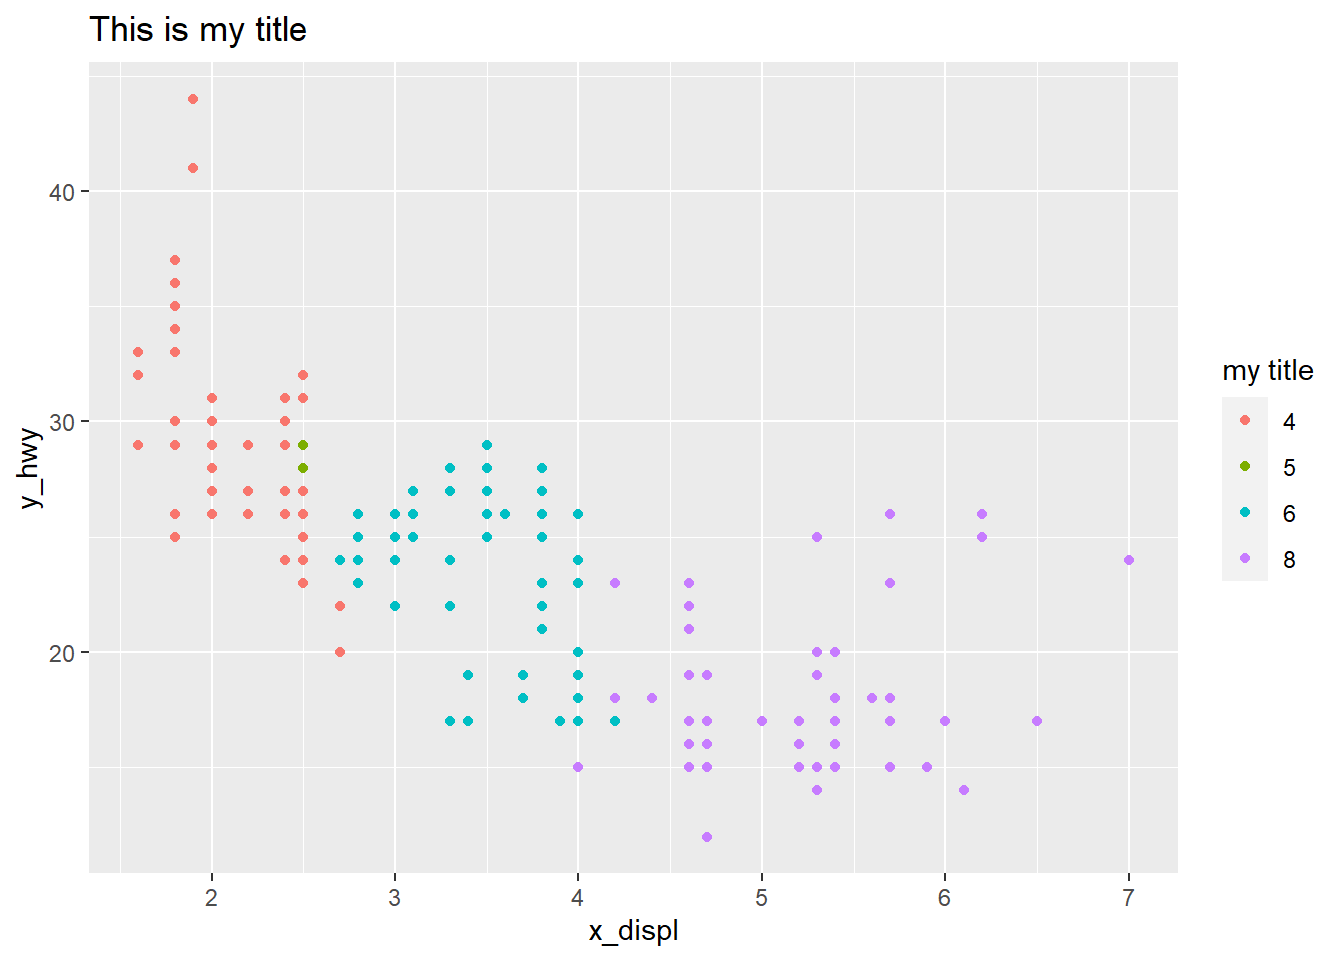
mpg %>%
  ggplot(aes(x = displ, y = hwy, color = factor(cyl))) +
  geom_point() +
  ggtitle("This is my title") +
  labs(x = "x_displ", y = "y_hwy") +
  guides(color = guide_legend(
                 title = "my title",
                 label.hjust = 1
                 )
  )
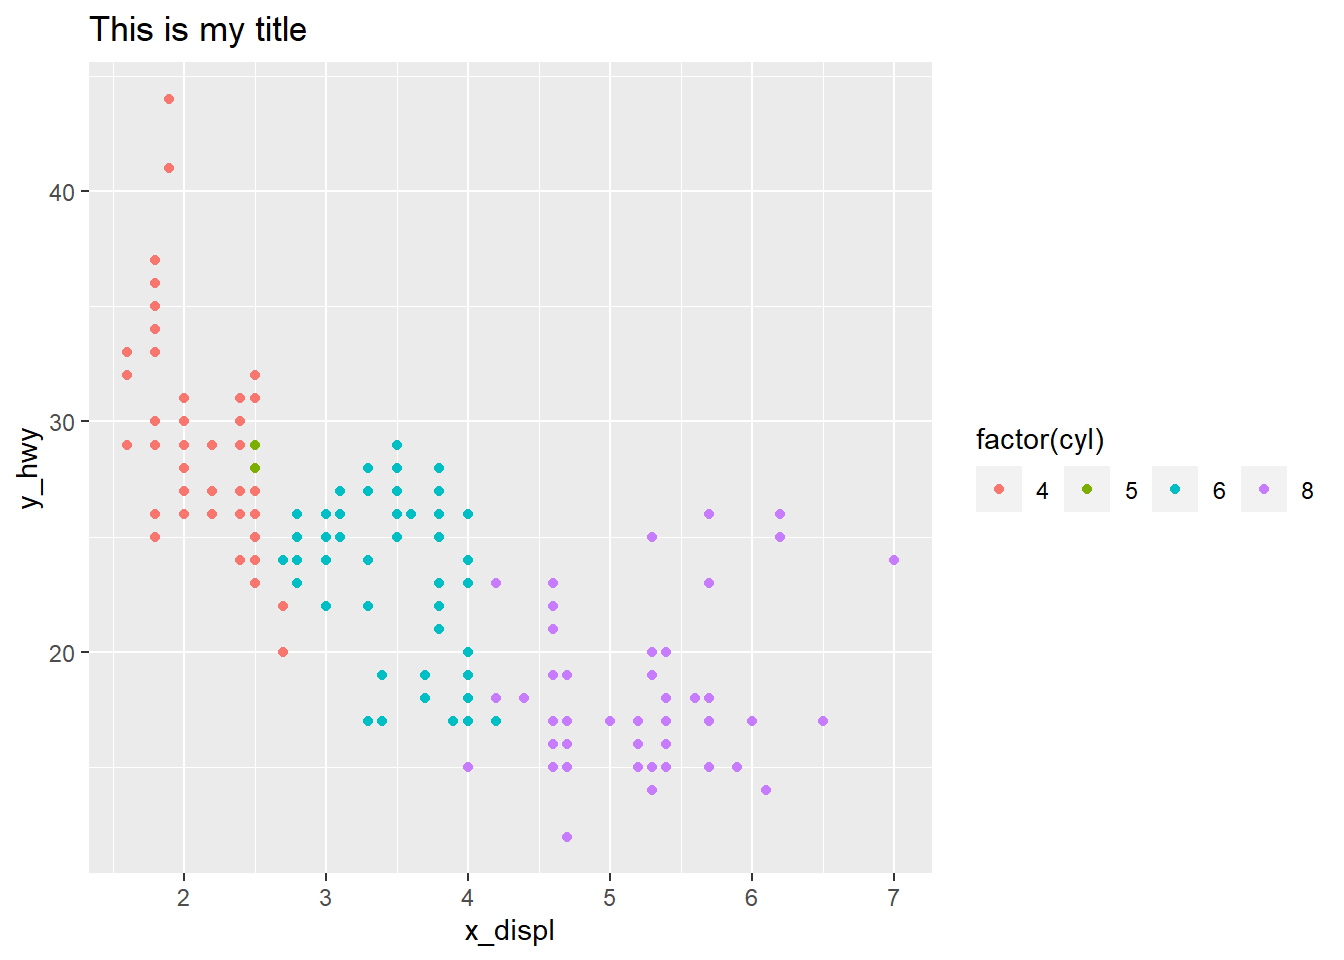
mpg %>%
  ggplot(aes(x = displ, y = hwy, color = factor(cyl))) +
  geom_point() +
  ggtitle("This is my title")  +
  labs(x = "x_displ", y = "y_hwy") +
  guides(color = guide_legend(
                   ncol = 4
                 )
  )
mpg %>%
  ggplot() +
  geom_jitter(aes(x = cty, y = hwy, color = class), key_glyph = draw_key_pointrange) + #<<
  guides(color = guide_legend(nrow = 1)) +
  theme(legend.position =  "top",
        axis.text = element_text(face = "italic", color = "navy"),
        plot.background = element_rect(fill = "#a0d1f2"),
        panel.background = element_blank(),
        panel.grid = element_line(linetype = "dotdash"))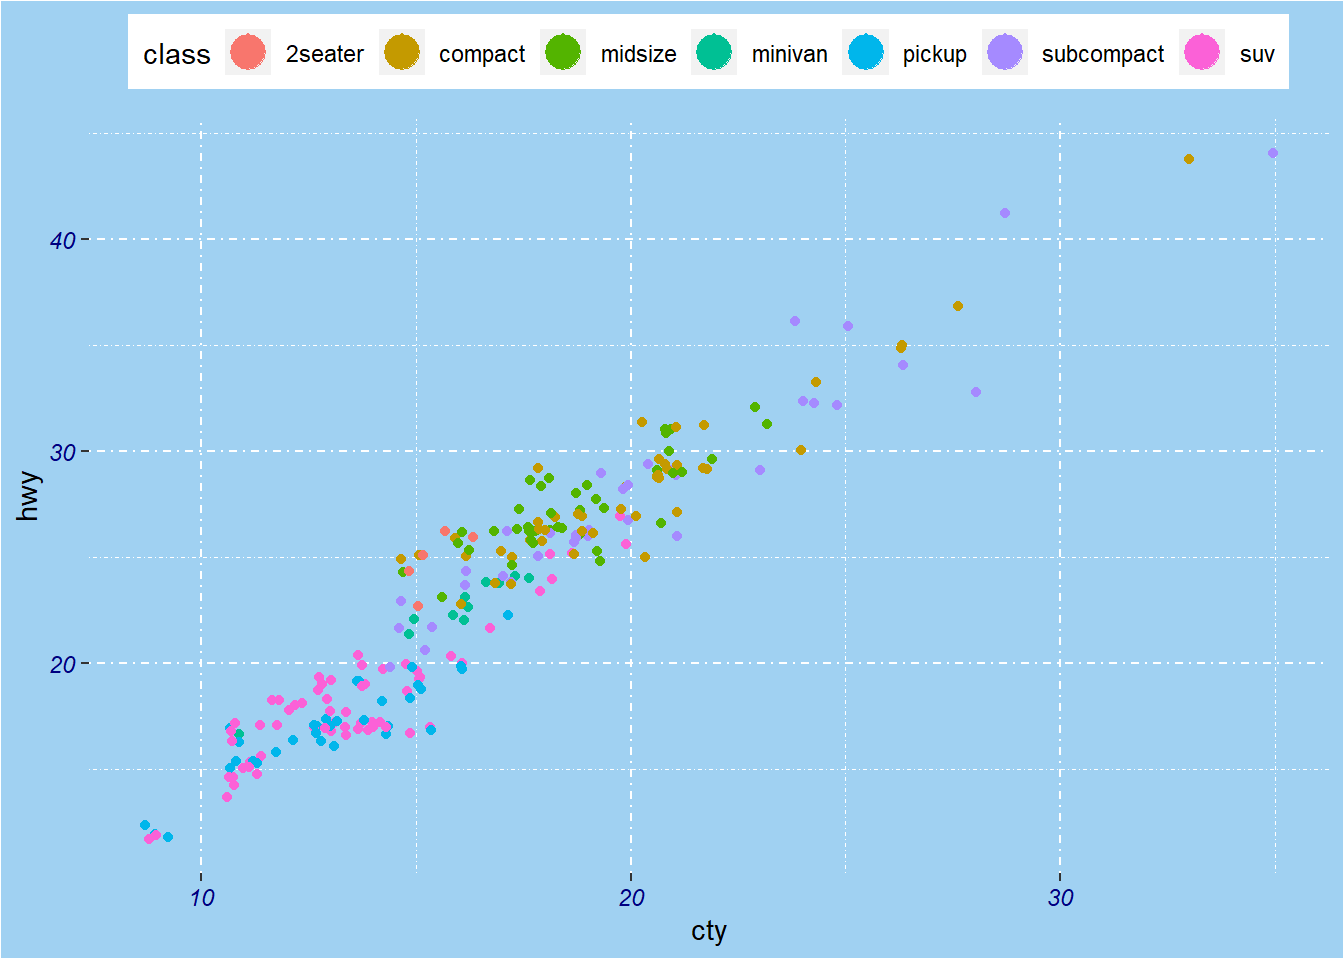
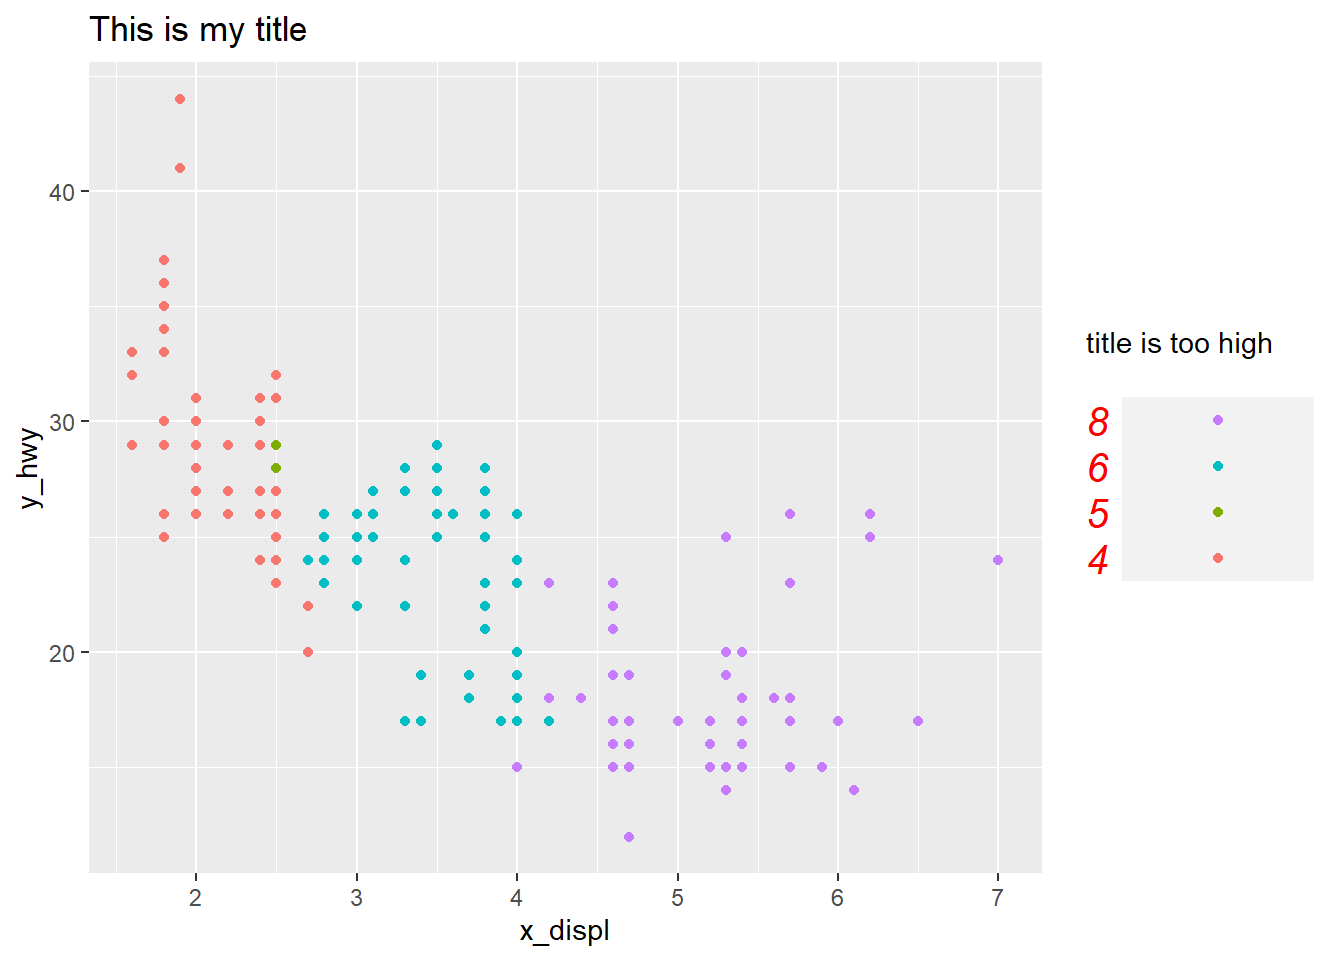
mpg %>%
  ggplot(aes(x = displ, y = hwy, color = factor(cyl))) +
  geom_point() +
  ggtitle("This is my title")  +
  labs(x = "x_displ", y = "y_hwy") +
  guides(color = guide_legend(
    title = "title is too high",
    title.position = "top",
    title.vjust = 5,
    label.position = "left",
    label.hjust = 1,
    label.theme = element_text(size = 15,
                               face = "italic",
                               colour = "red",
                               angle = 0),
    keywidth = 5,
    reverse = TRUE
   )
  )
25.3 删除其中一个图例
mpg %>%
  ggplot(aes(x = displ, y = hwy, color = class, size = cyl)) +
  geom_point()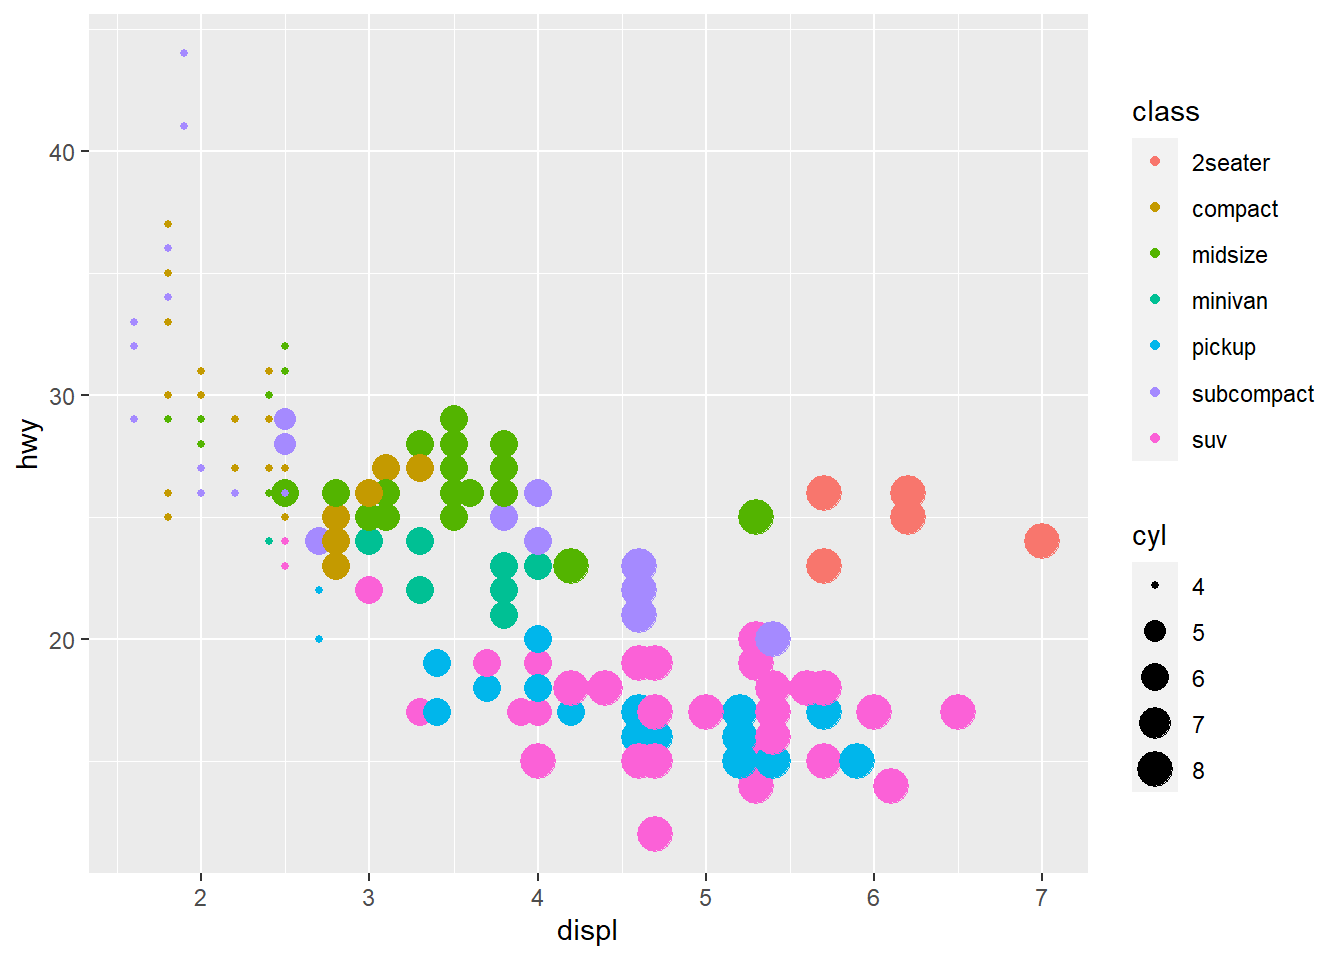
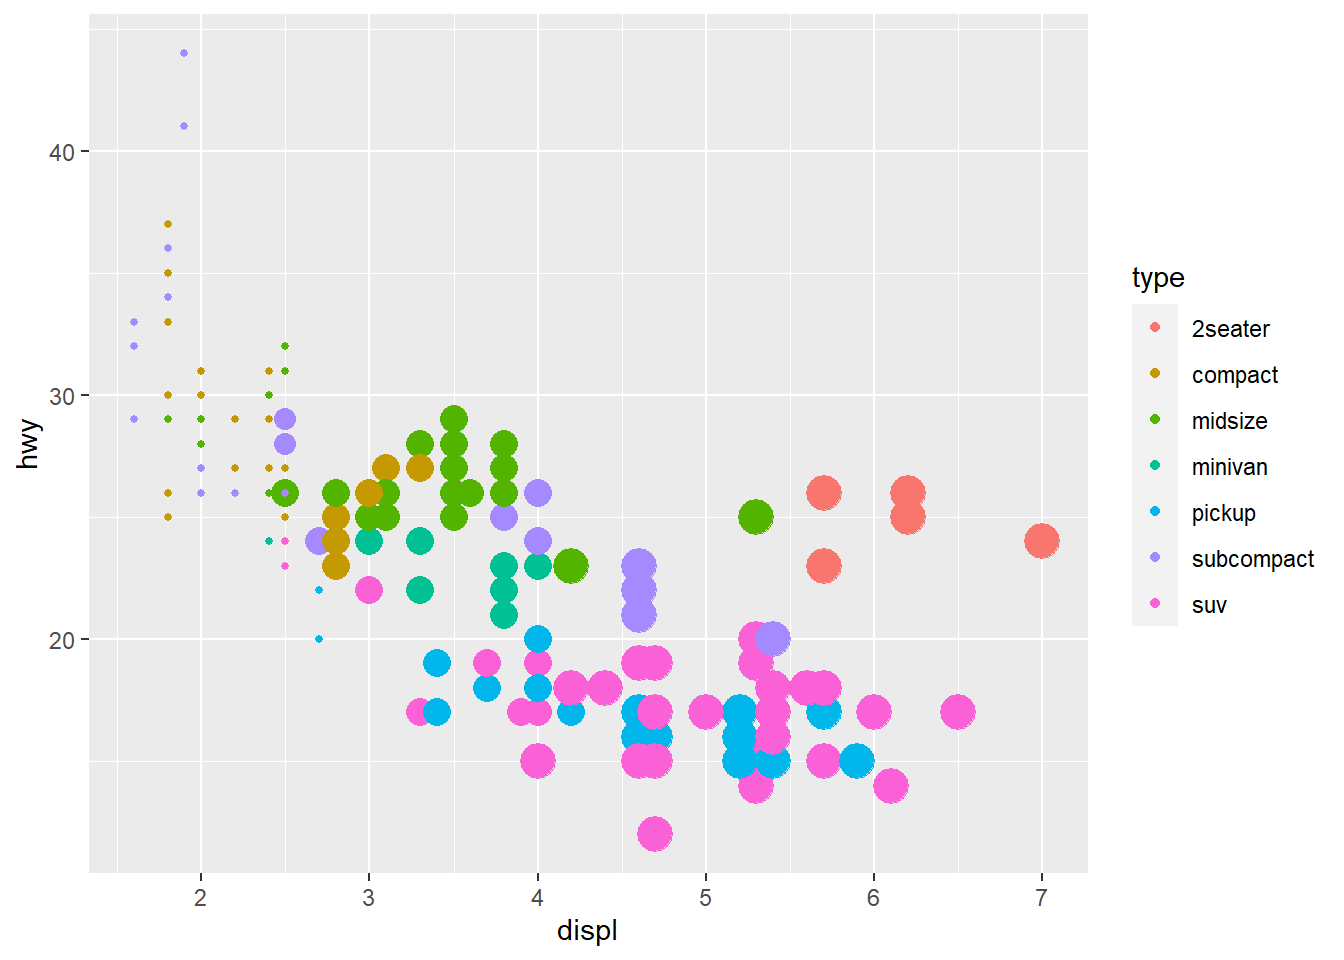
比如,我们想删除size这个图例,那么需要这样做
mpg %>%
  ggplot(aes(x = displ, y = hwy, color = class, size = cyl)) +
  geom_point() +
  guides(
    color = guide_legend("type"),      # keep
    size = "none"                      # remove
  )
或者
mpg %>%
  ggplot(aes(x = displ, y = hwy, color = class, size = cyl)) +
  geom_point() +
  guides(
    color = guide_legend("type"),      # keep
    size = guide_none()                # remove
  )
25.4 合并图例
library(tidyverse)
library(palmerpenguins)
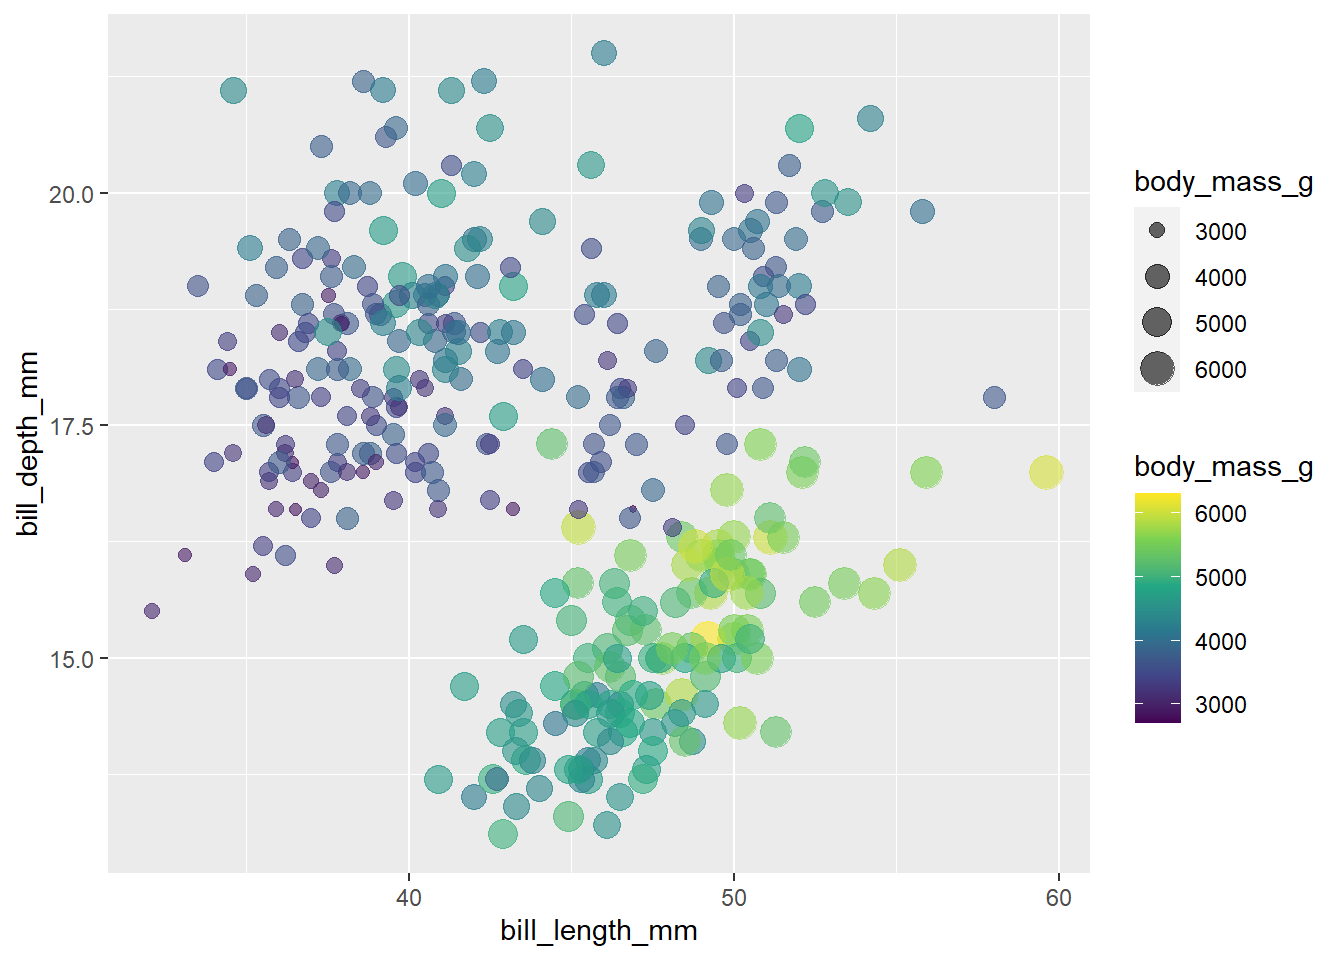
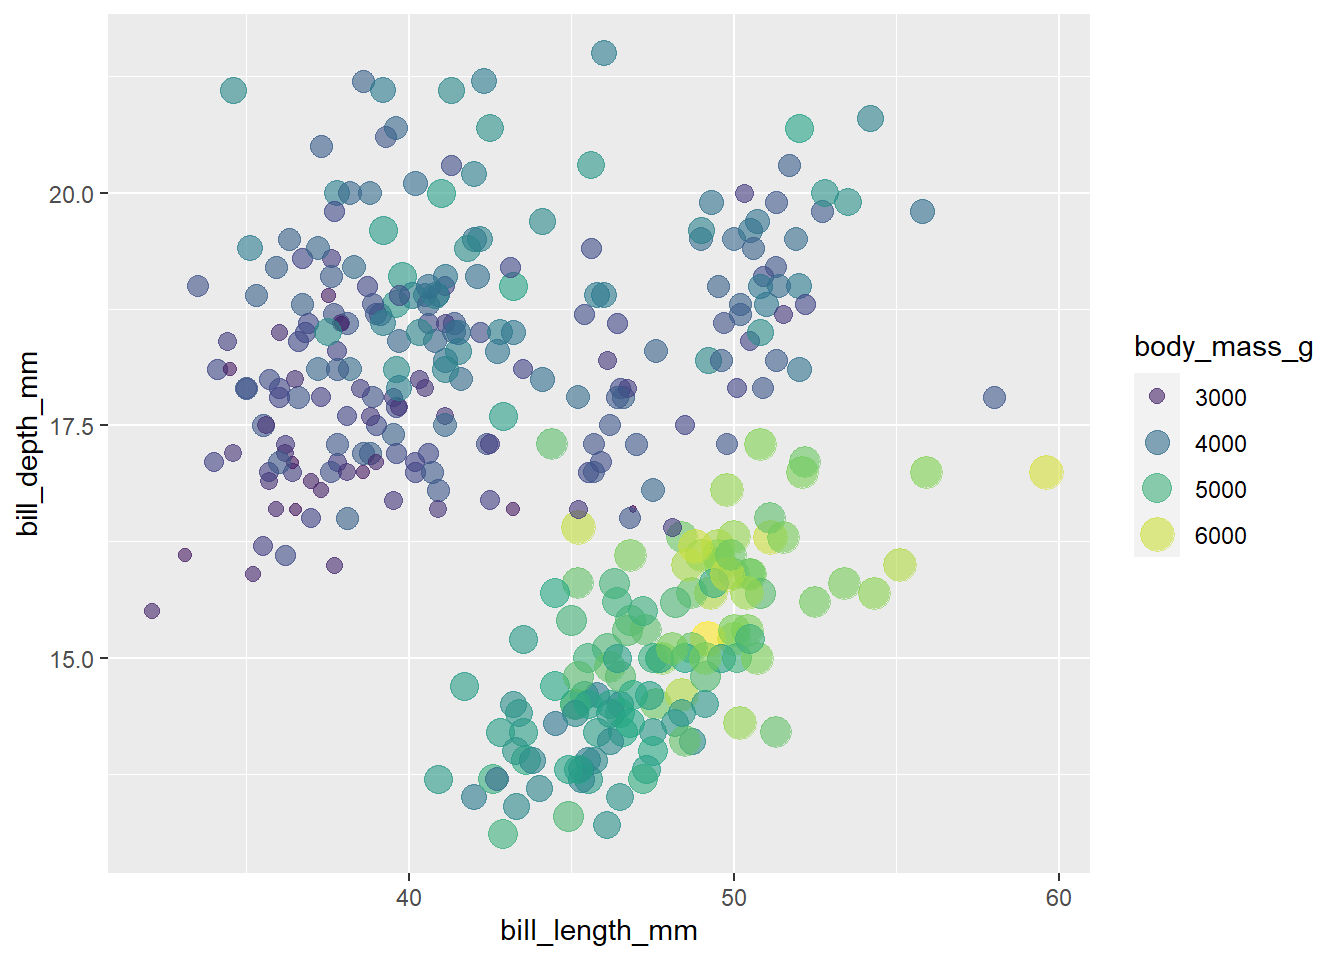
penguins %>%
ggplot(
aes(x = bill_length_mm, y = bill_depth_mm,
color = body_mass_g, size = body_mass_g)
) +
geom_point(alpha = 0.6) +
scale_color_viridis_c()
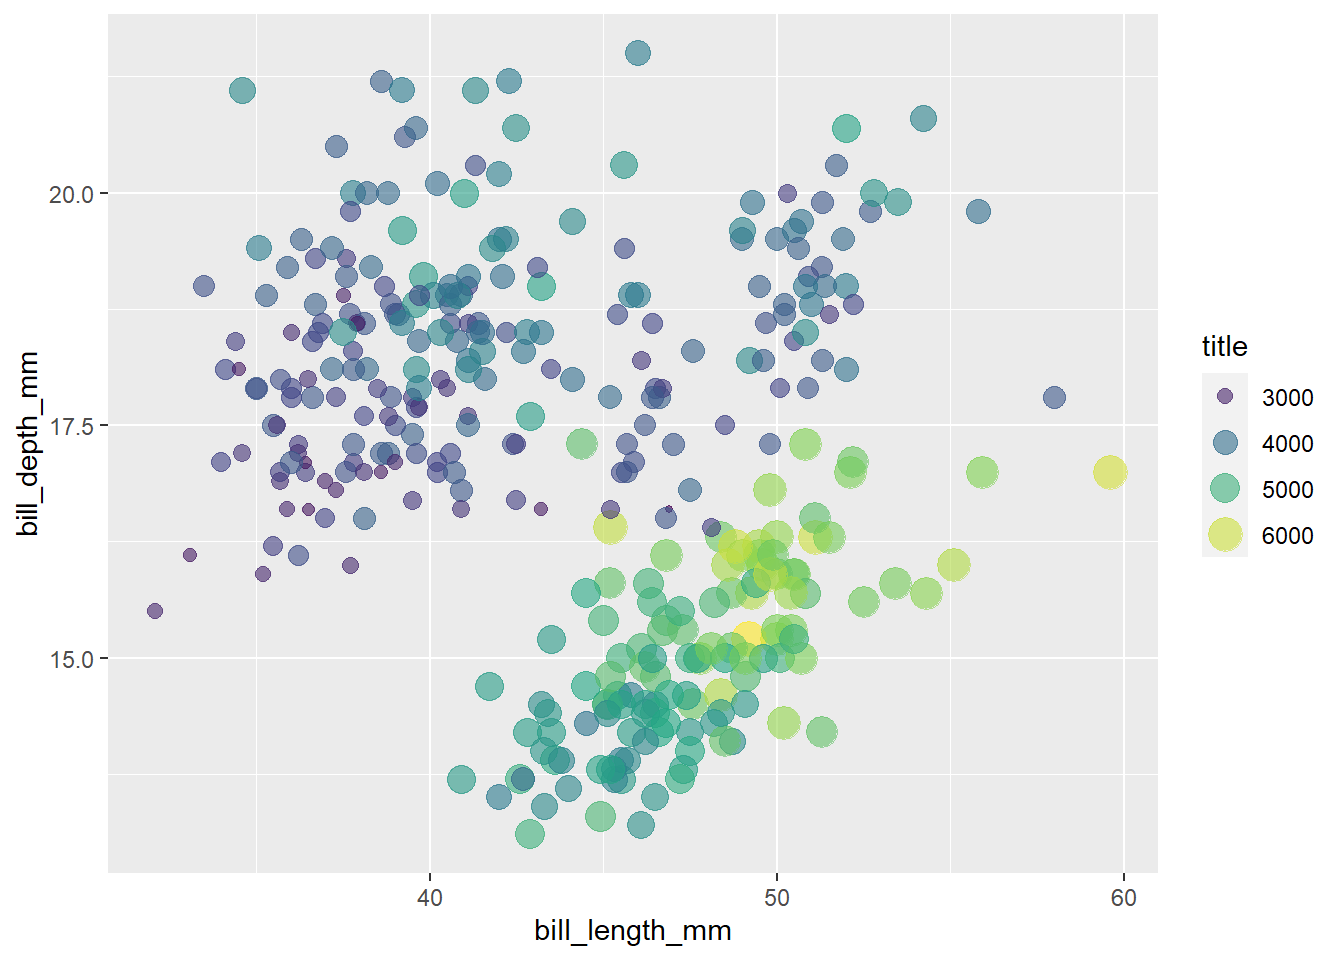
这里color 和 size 都使用了body_mass_g映射,我们可以将两者合并
# merge similar guides
penguins %>%
  ggplot(
    aes(x = bill_length_mm, y = bill_depth_mm,
      color = body_mass_g,size = body_mass_g)
  ) +
  geom_point(alpha = 0.6) +
  scale_color_viridis_c() +
  guides(color = guide_legend())
更直观的方法
penguins %>%
  ggplot(
    aes(x = bill_length_mm, y = bill_depth_mm,
      color = body_mass_g, size = body_mass_g)
  ) +
  geom_point(alpha = 0.6) +
  scale_color_viridis_c() +
  guides(
    color = guide_legend(),
    size = guide_legend()
  )
或者
penguins %>%
  ggplot(
    aes(x = bill_length_mm, y = bill_depth_mm,
      color = body_mass_g, size = body_mass_g)
  ) +
  geom_point(alpha = 0.6) +
  scale_color_viridis_c() +
  guides(
    colour = guide_legend("title"),
    size = guide_legend("title")
  )
最省力的是
penguins %>%
  ggplot(
    aes(x = bill_length_mm, y = bill_depth_mm,
      color = body_mass_g, size = body_mass_g)
  ) +
  geom_point(alpha = 0.6) +
scale_color_viridis_c(guide = "legend") 
25.5 小结
到了这里,ggplot2内容的差不多介绍完了,最后做下自我测试,能读懂下面代码(来源 Emi Tanaka)的意思?
mtcars %>%
  as_tibble() %>%
  ggplot(aes(x = wt, y = mpg, shape = factor(vs), color = hp)) +
  geom_point(size = 3) +
  colorspace::scale_color_continuous_sequential(palette = "Dark Mint") +
  scale_shape_discrete(labels = c("V-shaped", "Straight")) +
  labs(
    x = "Weight (1000 lbs)", y = "Miles per gallon",
    title = "Motor Trend Car Road Tests",
    shape = "Engine", color = "Horsepower"
  ) +
  theme(
    text = element_text(size = 18, color = "white"),
    rect = element_rect(fill = "black"),
    panel.background = element_rect(fill = "black"),
    legend.key = element_rect(fill = "black"),
    axis.text = element_text(color = "white"),
    plot.title.position = "plot",
    plot.margin = margin(10, 10, 10, 10)
  ) +
  guides(
    shape =
      guide_legend(override.aes = list(color = "white"))
  )