7.1 Digital Imaging
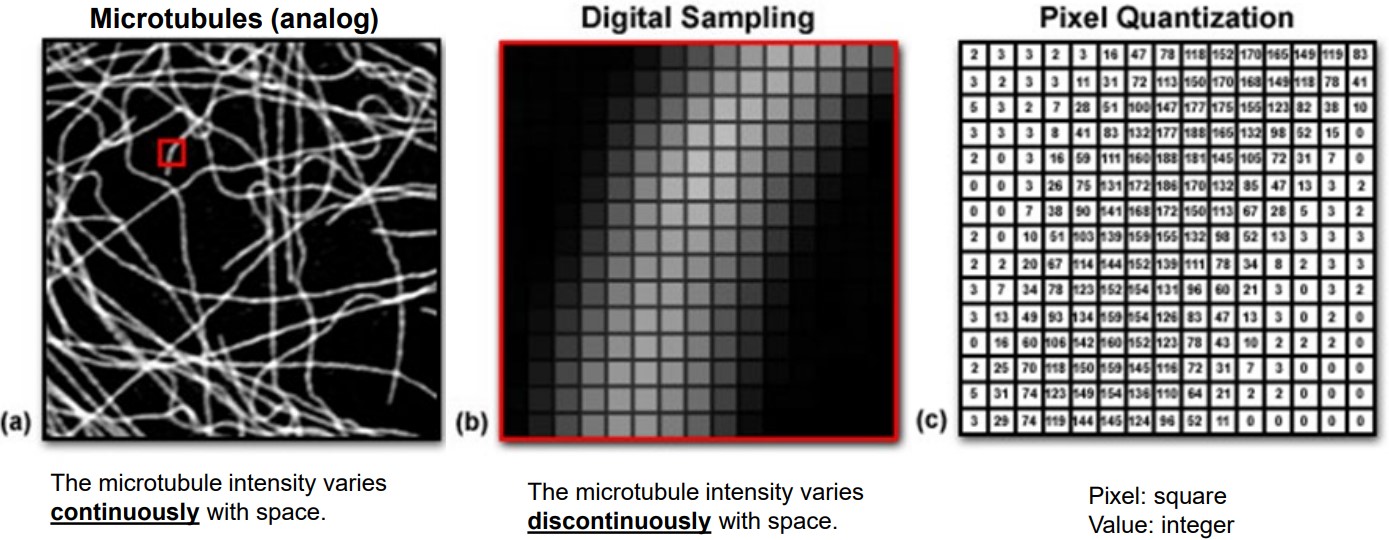
Figure 7.2: Steps in Imaging
When one attempts to image a biological sample (e.g., microtubules), the following steps are performed:
- A small sample of microtubules are selected to generate an analog (i.e., discontinuous) signal.
- This small sample then undergoes digital sampling to generate discrete signals.
- The sampling then undergoes pixel quantification - in the above figure, each pixel is a square and the darkness of the pixel the value in the square.
7.1.1 Dyanmic Ranges in Imaging
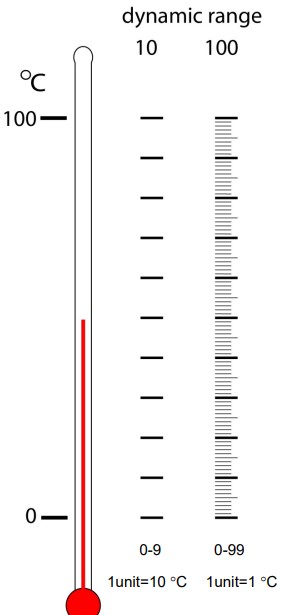
Figure 7.3: An Example of a Dynamic Range
The dynamic range of an image sensor is the number of all possible light intensities that an image sensor can measure. Some common sensors include a CCD (i.e., Charge Coupled Device) or a PMT (i.e., Photo Multiplier Tube).
The dynamic range of an image is the number of possible values of a pixel.
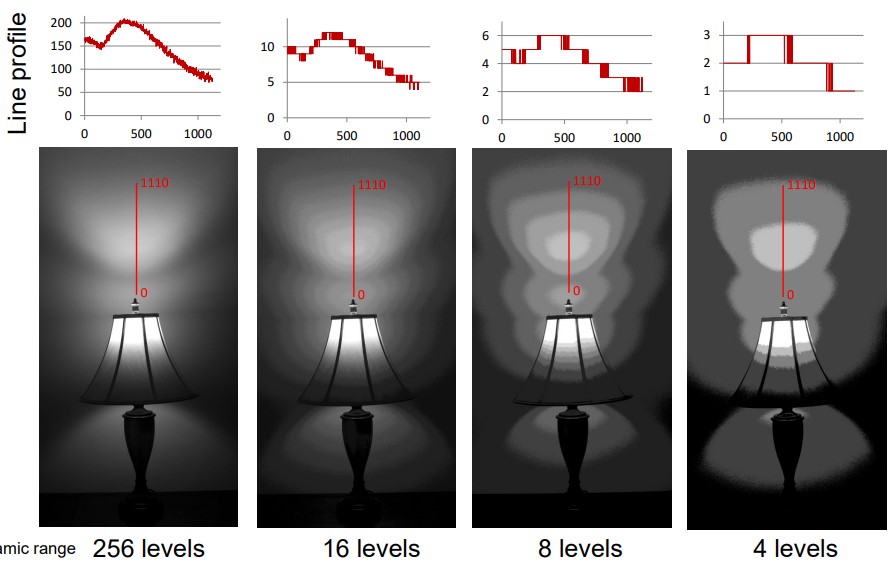
Figure 7.4: Dynamic Range Effects on Image Quality
When a dynamic range is higher, the more precisely (or the wider the range) of the intensity that can be measured.
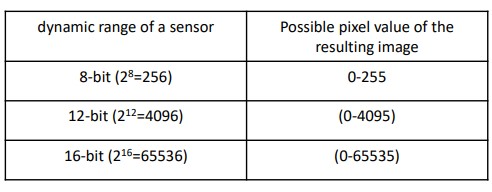
Figure 7.5: Dyanmic Ranges in Bits
Dynamic ranges are often indicated in the number of bits.
7.1.2 Image Histograms
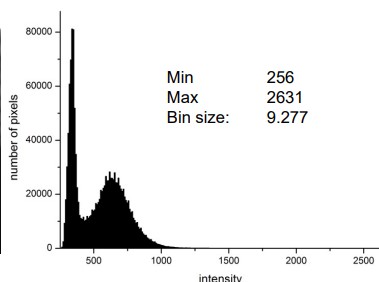
Figure 7.6: Example of an Image Histogram
In a typical image histogram, the:
X-axis
…represents the intensity or pixel value.
Y-axis
…represents the number of pixels in a bin.
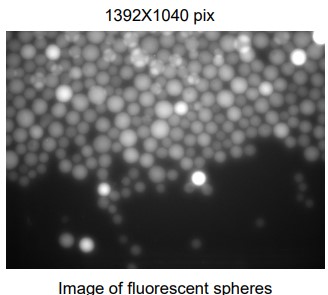
Figure 7.7: A Photograph of Fluorescent Spheres
Image histograms show a graphical representation of an image’s pixel intensity.
7.1.2.1 Avoiding Pixel Saturations
Saturations happens when the number of photoelectrons exceeds the full well capacity of an image sensor. Consequently, this causes the pixel value to be truncated: this is a problem as the true value of a saturated pixel is unknown and could range from the maximum value of the dynamic range to infinity.
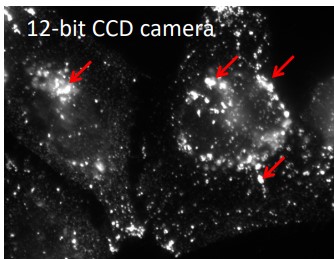
Figure 7.8: Example of a Saturated Image
Some possible ways to avoid saturation include the following:
- Use less gain and / or amplification when dealing with the image sensor.
- Reduce the exposure time.
- Reduce the intensity of the excitation light.
Different parameters (e.g., various exposure times, various intensitie of excitation lights, and adjusting gains) should be used so that the maximum value of the image is roughly 50% to 70% of the dynamic range.