13.3 Types of MR Images
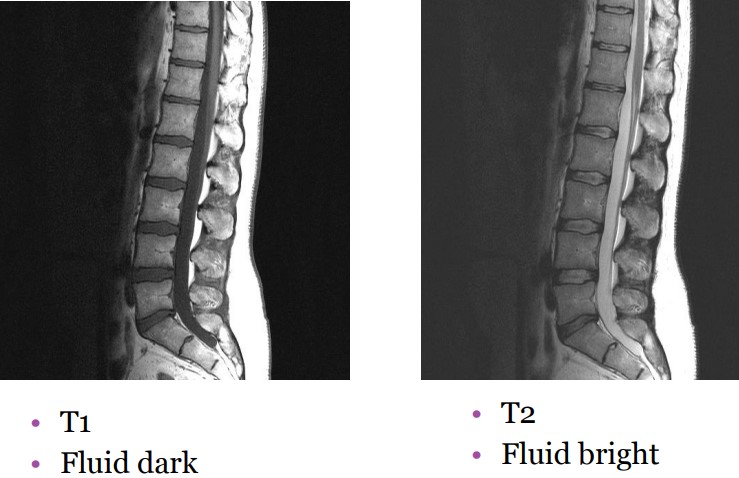
Figure 13.9: Types of MR Images
99% of body tissues produce an MR signal, each with unique properties such as molecular structure, the number of H+ ions, and whether they are moving or stationary.
13.3.1 T1 and T2 Relaxation
There are two kinds of relaxation
Longitudinal
This is where protons are pulled back into allignment with the main magnetic field of the scanner (i.e., B0), hence reducing the size of the magnetic moment vector in the xy plane.
Transverse
This is where protons become out of phase, hence leading to a drop in the net magnetic moment vector (i.e., M0).
Transverse relaxation happens much quicker than longitudinal relxation - tisuse contrast is determined by these differences.
13.3.2 T1 and T2 Relaxations
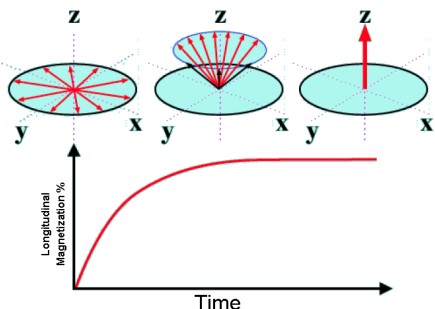
Figure 13.10: T1 Relaxation Graph
The above graph shows the recovery of longitudinal orientation of M along the z-axis. T1 time is the time interval for 63% recovery of longitudinal magnetization.
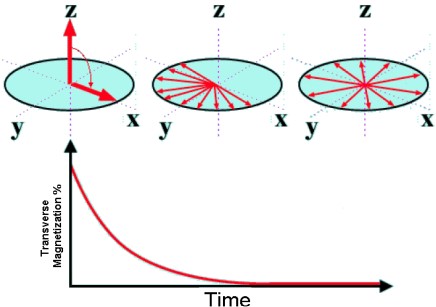
Figure 13.11: T2 Relaxation Graph
The above graph is that for the loss of transverse magnetization Mxy. T2 time is the amount of time for 37% loss of the original, transverse magnetization.
13.3.3 MR Image Construction
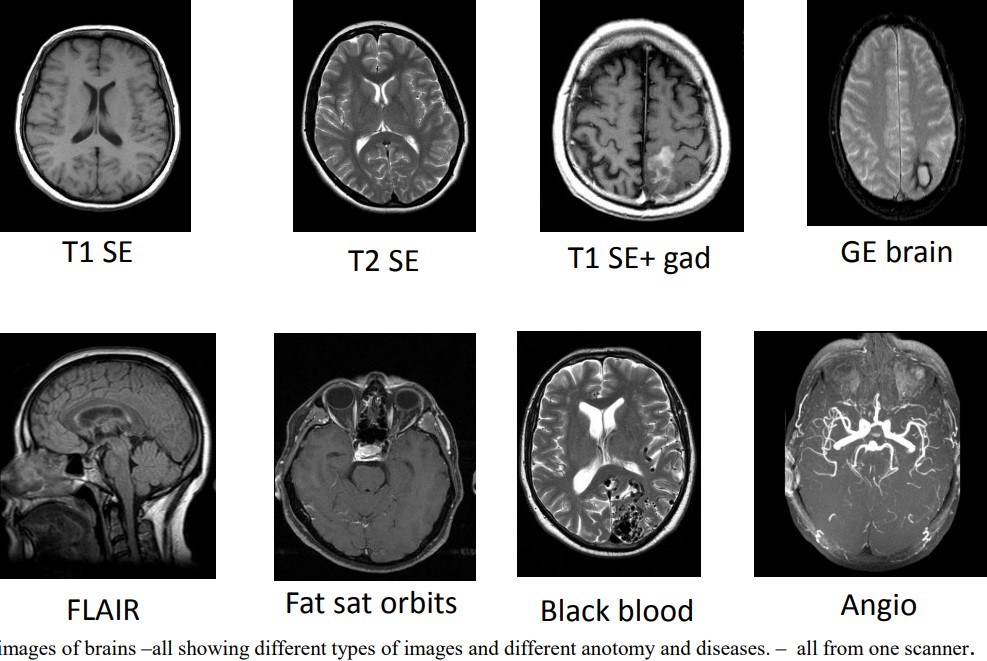
Figure 13.12: Differing MRI Scans of a Brain
Images are constructed when protons return to different tissues at various rates. There are five variables that affect the latter rate:
- Spin density (i.e., the concentration of nuclei in tissue processing in a given region under a magnetic field)
- T1
- T2
- Flow
- Spectral shifts (i.e., the angle / zoom that the picture is taken from)
In a…
T1 weighted image
Water appears darker while fat is brighter. There is a good gray matter to white matter contrast in the brain.
T2 weighted image
Fat appears darker while water appears lighter. This makes it an ideal image type for imaging edemas6
13.3.3.1 T1 and T2 Values for Tissues
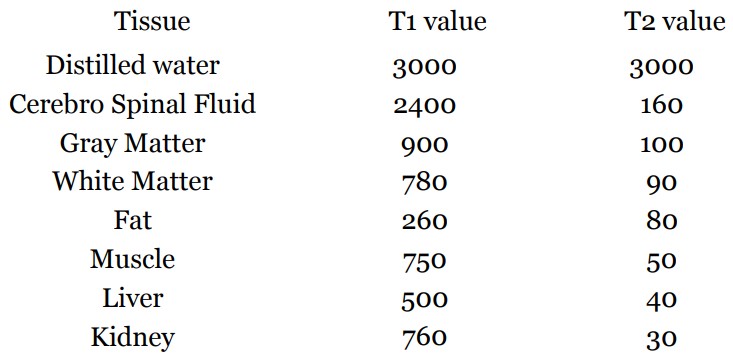
Figure 13.13: Different T1 and T2 Values for Tissues
The above values were taken in a magnetic field strength of 1.5T (where each organ has its own specific T1 and T2 values).
As seen above, fat has much lower / shorter values than water / fluid.
The scanner should separate out differences between T1 and T2 values - if we can see how individual tissues behave normally or abnormally, then we can identify and classify disease processes.
13.3.4 Contrast in MRI
There are two main controls:
- Repetition Time (i.e., TR) conrols T2 weighting.
- Echo Time (i.e., TE) controls T1 weighting
Longitudinal and transverse relaxation determines T1 and T2 contrast respectively.
The echo time is the the time after 90 degrees RF pulses until readout. This determines how much transverse relaxation will occur before reading one row of the image.
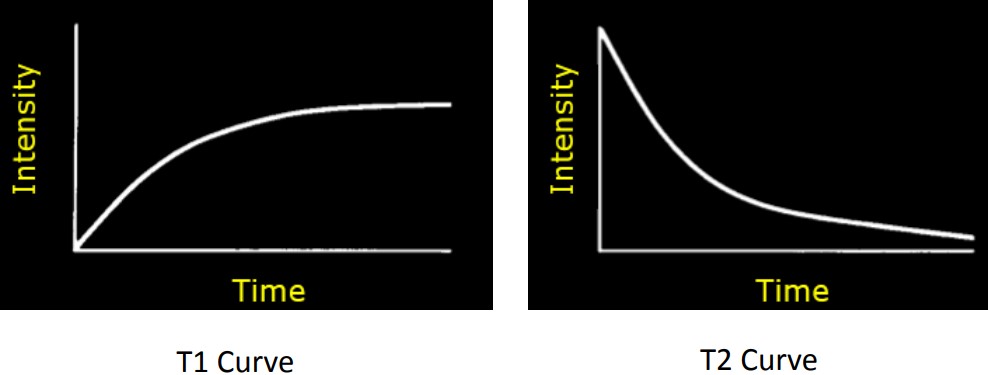
Figure 13.14: T1 and T2 Relaxation Curves
The repetition time is the time between successive 90 degrees RF pulses. This determines how much longitudinal relaxation will occur before constructing the next row of the image.
These are the abnormal accumulation of fluid beneath the skin or in one or more cavities of the body↩︎