13.4 MRI Weightings
This section deals with T1 and T2 weightings.
13.4.1 T1 Weighting
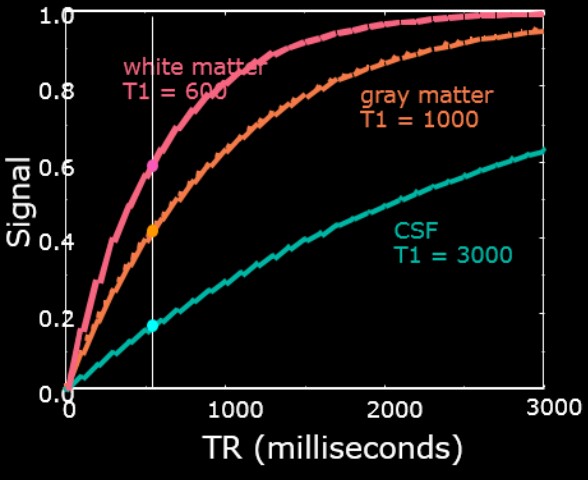
Figure 13.15: T1 Weighting
In a T1 weighting, all curves in the above figure come together at long TRs. A long TR will minimize the effect of a T1 contrast.
A short TR of about 500 milliseconds to about 1500 milliseconds will give a good T1 contrast between all three tissue types.
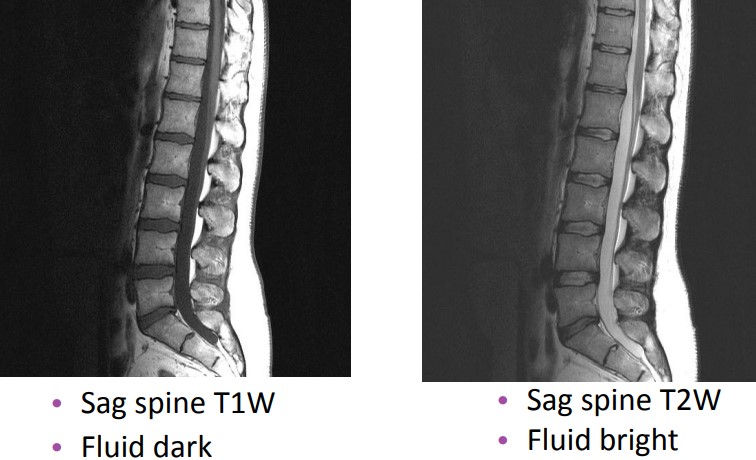
13.4.2 T2 Weighting
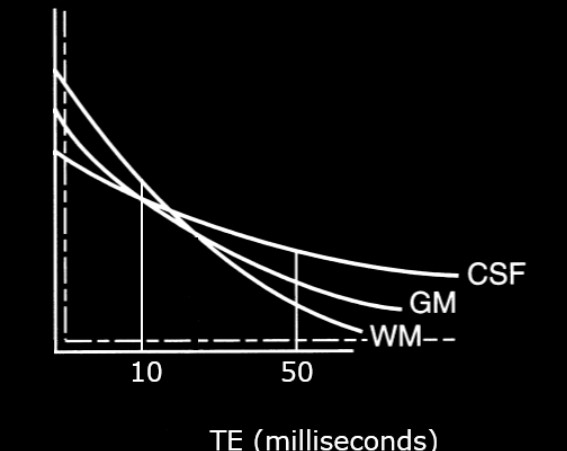
Figure 13.16: T2 Image Weightings
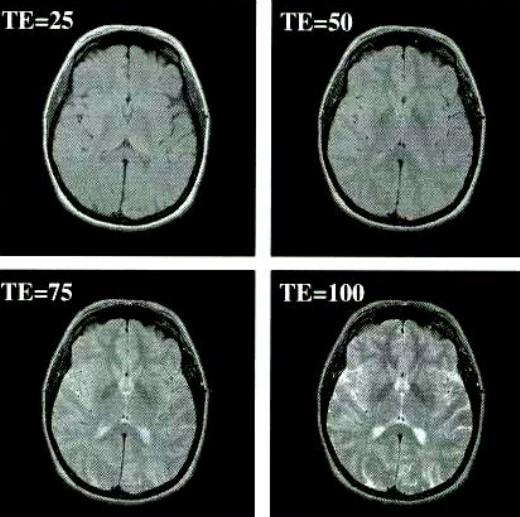
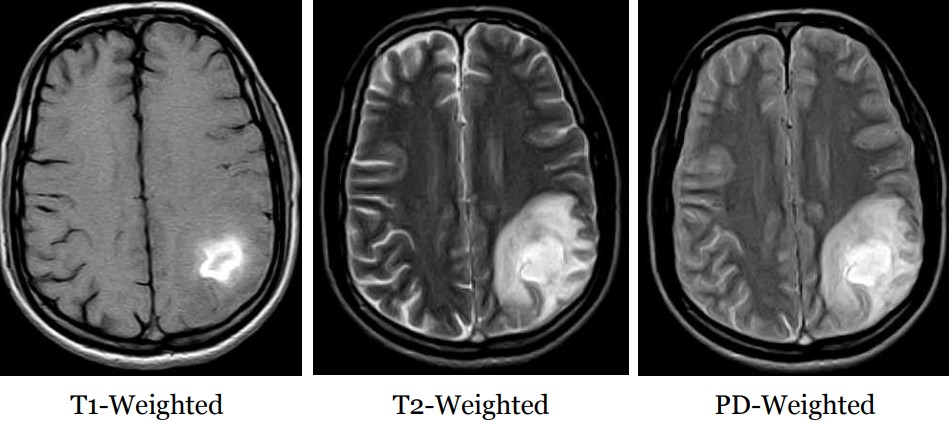
Figure 13.17: T2 Images with Varying Contrasts
A short TE (i.e., about 20 milliseconds) leads to a short T2 contrast, while a longer TE (i.e., about 50 milliseconds) has a good separation between each tissue type.