11.2 Imaging Modalities
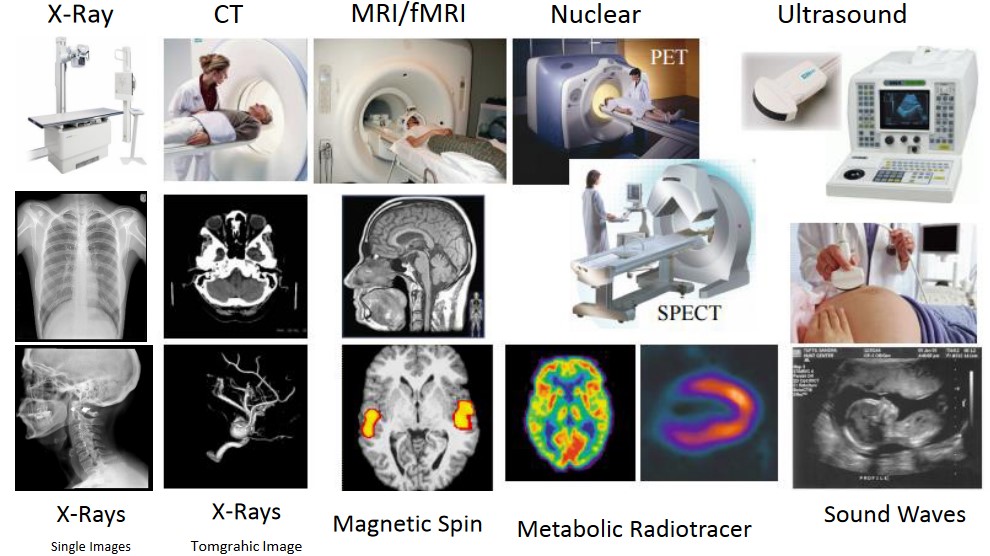
Figure 11.5: Image Modalities
The above figure lists some common image types in the medical field.
11.2.1 X-Rays
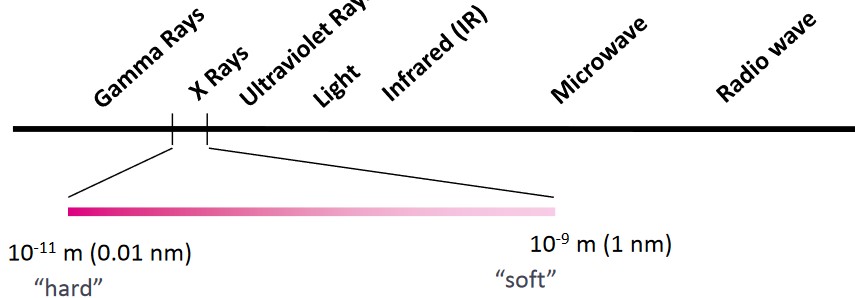
Figure 11.6: Spectrum of X-Rays
X-rays are typically detected as particles of energy (i.e., photons). They were found in 1895 by Wilhelm Conrad Roentgen.
11.2.1.1 X-Ray Films
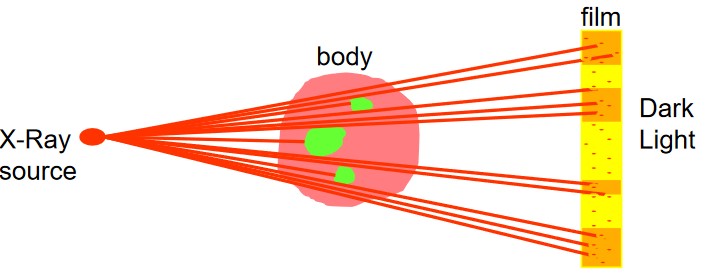
Figure 11.7: Illustration of how an X-Ray Film Works
Proper film exposures can be obtained from the characteristic curve of the film material. The blackening of the film (which contains grains of silver bromide) after x-ray exposure is expressed in terms of optical density.
The grains in the film develop into a silver speck if an x-ray hits it. If light then hits the silver specks, they are completely absorbed.
11.2.1.2 X-Ray Interactions
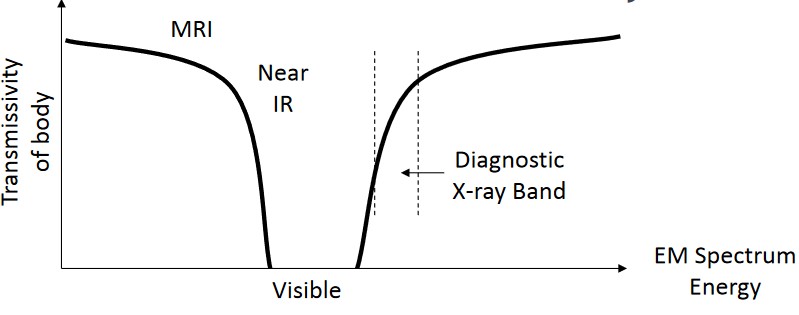
Figure 11.8: Interactions of X-Rays
X-ray imaging requires x-ray photon and object interactions in a specific band:
- Above the band, the body becomes too transparent.
- Below the band, the body becomes too opaque (i.e., wavelengths are too long).
However, x-rays do not provide any depth information. Variation in the amount of x-rays absorbed by various tissues provides a contrast image.
11.2.1.3 Radiographic Densities
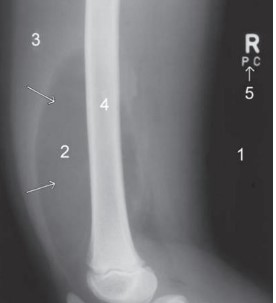
Figure 11.9: X-Ray of a Child’s Thigh Containing Benign Lipomas (i.e., the arrows)
The following numbers in the above picture represents the following:
- Air
- Fat
- Soft tissue
- Bone
- Metal
As x-rays pass through the body, some rays are absorbed or scattered, producing an altercation of the x-ray beam.
Tissues that are dense may cause more attenuation and appear light grey. Less dense tissues appear darker (as they don’t cause as much attenuation).
11.2.1.4 Image Noise
Noise may come from several sources:
- Fluctuations in the number of absorbed x-ray photons per unit area.
- Fluctuations in the absorbed photon energy
- Fluctuations in the number of silver halide per unit area of emulsion
Sources 1. and 3. are the main sources for noise (i.e., quantum mottle and random darkening).
11.2.1.5 Clinical Applications of X-Ray Radiography and Pros and Cons
X-Rays can be applied to several body parts - for instance:
Chest
To assess lung pathology.
Skeleton
To examine bone structures to diagnose fractures, dislocations, and other kinds of injuries.
Abdomen
To look for any abdominal obstructions.
Dental
To assess dental pathologies (e.g., cavities and abcesses).
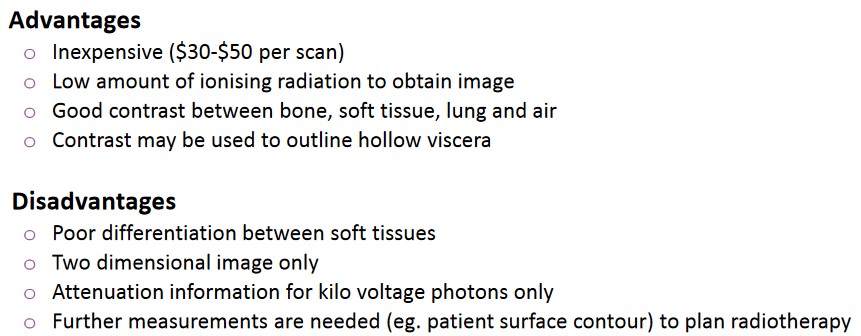
Figure 11.10: Advantages and Disadvantages of X-Rays
The above figure lists some advantages and disadvantages of utilizing x-rays in a medical setting.
11.2.2 X-Ray Computed Tomography (i.e., CT)
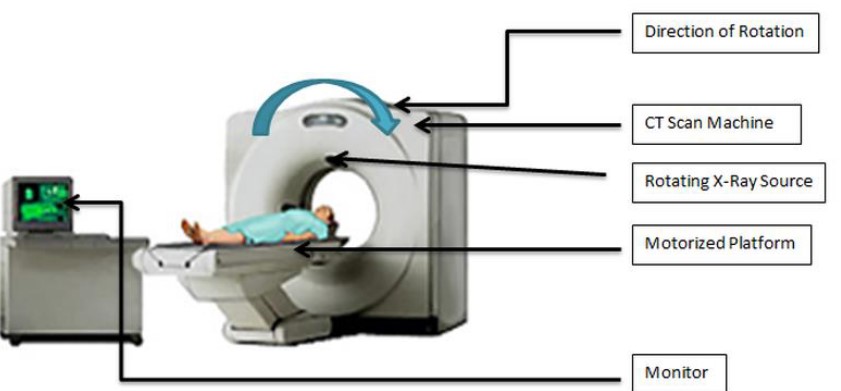
Figure 11.11: An Image of a CT Scan
A CT scan uses combinations of many x-ray images from various angles to produce cross-sections.
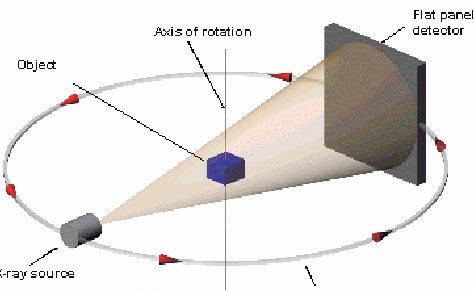
Figure 11.12: Schematic of How a CT Scan Works
In a CT scan, slices inside an object are taken around a single axis of rotation.
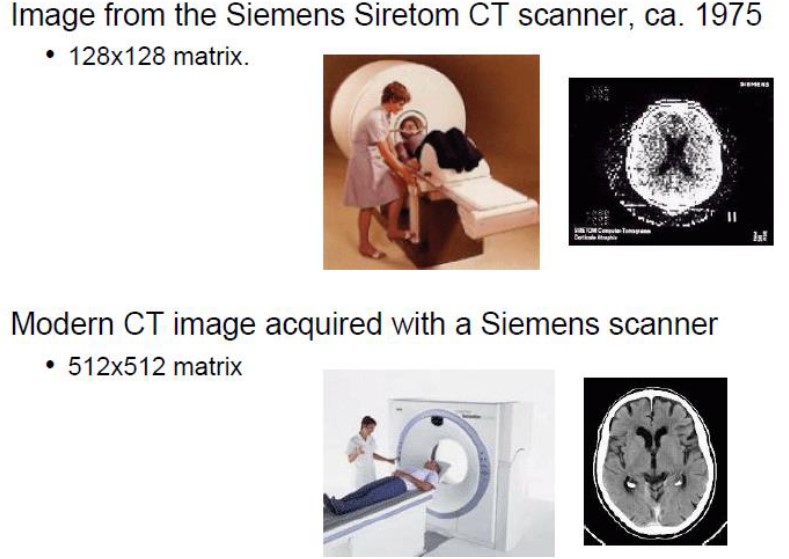
Figure 11.13: CT Scanners Over Time
The above figure shows some improvements in CT technology over time.
11.2.2.1 How Does a CT Scan Work?
Electromagnetic energy is used to blast the patient from various angles; different parts absorb beams differently. Contrast material (i.e., dyes) can also be used to enhance images.
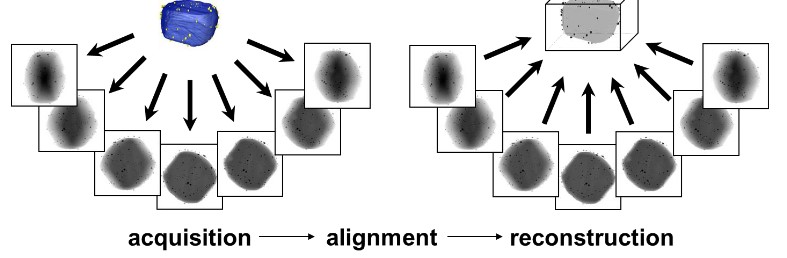
Figure 11.14: Multiple Images Acquired from a CT Scan
The tomographic image of a sample is a picture of a slab of the patient’s anatomy. The slice’s thickness is about 1 - 10 nm and is uniform.
The 2D array of images in the CT image corresponds to an equal amount of 3D voxels (i.e., volume elements) in the patient.
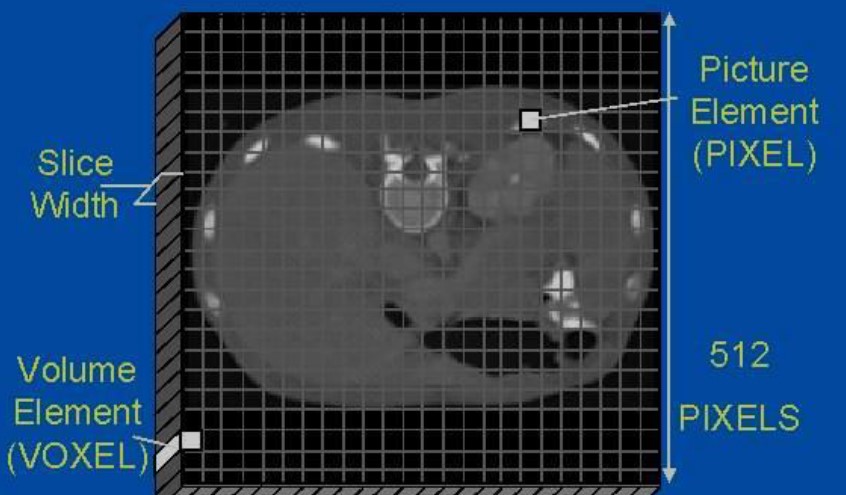
Figure 11.15: Illustration of a Voxel
Each pixel on the tomographic image displays the average x-ray attenuation properties of tissue in the corresponding voxel.
A ray is a single transmission measurement through the patient by a single detector. A series of rays that pass through the patient at the same time is called the projection or view.
There are two projection geometries:
Parallel beam geometry
This is when all rays are parallel to one another.
Fan beam geometry
This is when the rays at a given projection angle diverge.
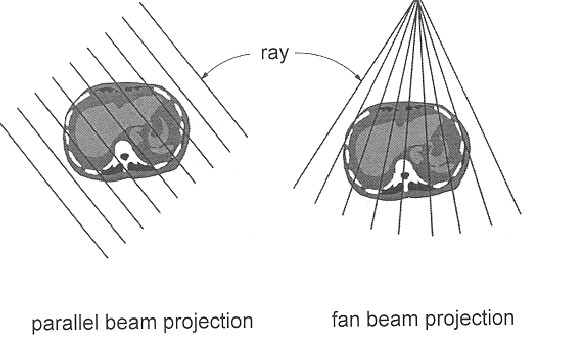
Figure 11.16: Beam Projection Geometries
A single CT image may involve about 800 rays from 1000 different projection angles. Prior to acquiring the following slice, the table that the patient lies on is moved slightly in the z-direction.
Filtered back projection reconstruction is the most-widely used in clinical CT scanners. This method builds up the CT image by reversing acquisition steps.
The μ value for each ray is also smeared along the same path as the patient. Areas with high attenuations reinforce one another as do areas of low attenuation, hence reinforcing the image.
11.2.2.2 Generations of CT Scanners
There are three generations:
First Generation: Rotation / Translation with a Pencil Beam
Parallel ray geometry is used along with two x-ray detectors
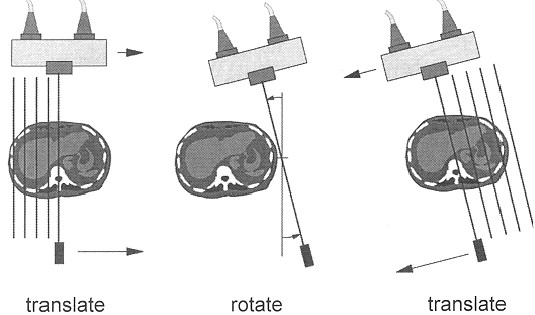
Figure 11.17: First Generation CT Scanners
160 rays are acquired across a 24 cm field of view. It takes about 4.5 minutes per scan with 1.5 minutes of reconstruction.
Second Generation: Rotation / Translation with a Fan Beam
This generation of CT scanners utilizes a linear array of 30 detectors. More data is acquired to improve image quality.
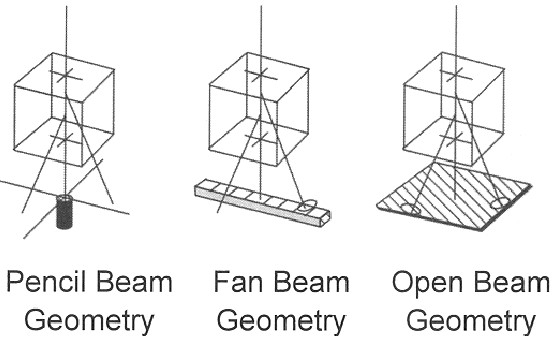
Figure 11.18: Different Beam Geometries
The shortest scanning time was 18 seconds per slice; narrow fan beams allow for more scattered radiation to be detected.
Third Generation: Rotation with a Wide Fan Beam
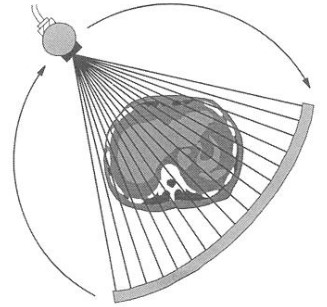
Figure 11.19: Illustration of a Wide Fan Beam
The amount of detectors have substantially increased to more than 800 detectors. The angle of the fan beam has also expanded to cover the entire patient.
Newer systems have scan times of about 0.5 seconds. The x-ray tube and the detector array rotate together.
Fourth Generation: Rotating and Stationary
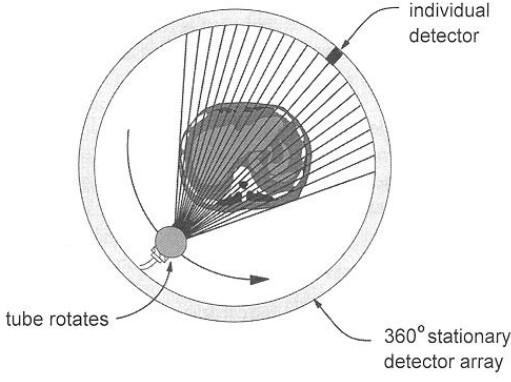
Figure 11.20: Inner Workings of a Fourth Generation CT Scanners
This generation of ring artifacts overcomes ring artifacts. Fourth generation CT scanners are comprised of a stationary ring with 4800 detectors.
Fifth Generation: Stationary and Stationary
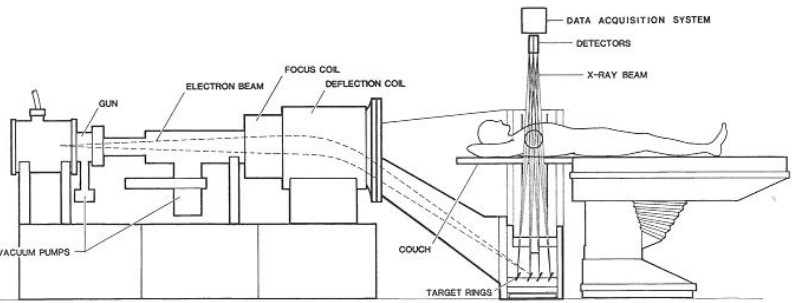
Figure 11.21: Setup of a Fifth Generation CT Scanner
This generation was built specifically for cardiac tomographic imaging. No conventional x-ray tubes are used, but large arcs of tungsten encloses the patient and lies opposite the detector ring.
The electron beams are steered around the patient to strike the tungsten target.
This generation of CT scanners can have 50 millisecond scanning times. It is also capable of producing fast-frame CT movies of the beating heart.
Sixth Generation: Helical
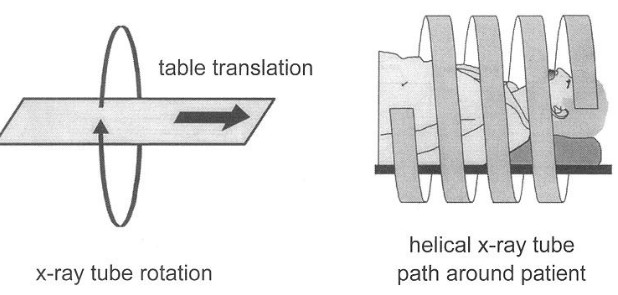
Figure 11.22: Illustration of a Helical CT Scanner
Helical CT scanners acquire data when the table is moving. The total amount of time required to image the patient is significantly reduced by avoiding having to translate the patient’s table.
In some instances, the entire scan be done within a single breath-hold of a patient.
Seventh Generation: Multiple Detector Array
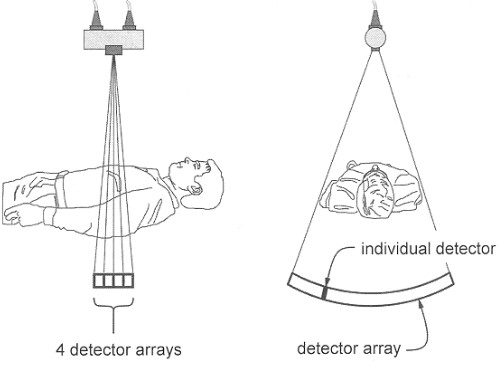
Figure 11.23: Illustration of a Seventh Generation CT Scanner
The collimator spacing is wider and more of the x-rays that are made by the tube are used in making image data.
Opening up the spacing increases slice thicknesses (and hence reduces spatial resolution in the slice thickness’ dimension). Here, slice thickness is determined by detector size (and not by the collimator).
11.2.2.3 Ring Artifacts
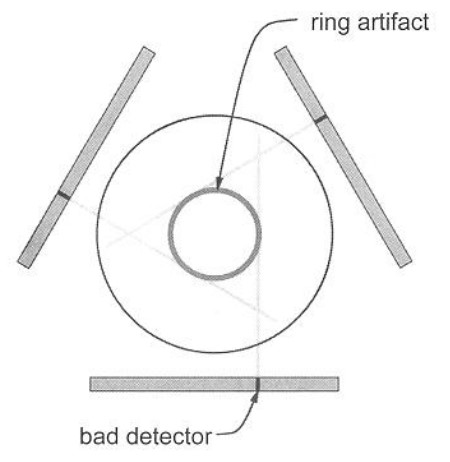
Figure 11.24: An Example of a Ring Artifact
The rotation geometries of third generation CT scanners can lead to a situation where each detector is responsible for the data corresponding to a ring in the image.
Drift in the signal levels over time affect the μt value that are back projected to produce the CT image, hence causing ring artifacts.
11.2.2.4 Contrast Agents
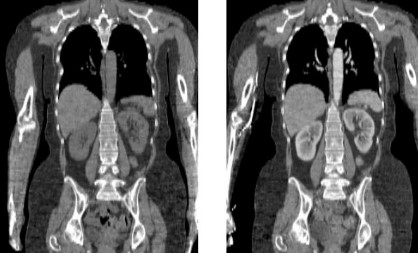
Figure 11.25: Iodine-Based Enhancements for CT Scans
Iodine and Barium-based contrast agents (i.e., compounds with a high Z) can be used to enhance blood vessels and to show breakdowns in vasculature.
Iodine is typically used for blood flow and barium (swallowed) for the digestive tract.
11.2.2.5 Adverse Effects and Advantages and Disadvantages
Radiation from CT scans can damage cells - especially their nuclei, hence leading to cancer. The most common effects from intravenously-administered radiocontrast agents are mild, including nausea, vomiting, and an itching rash.
The contrast agent mentioned above may also induce nephropathy.
Barium sulfate also cannot be used in patients who are suspected to have bowel perferations (lest the barium sulfate causes fatal peritonitis).
A typical CT scan can involve about 10 - 20 mGy of radiation for specific organs and even up to 80 mGy for specialized CT scans.
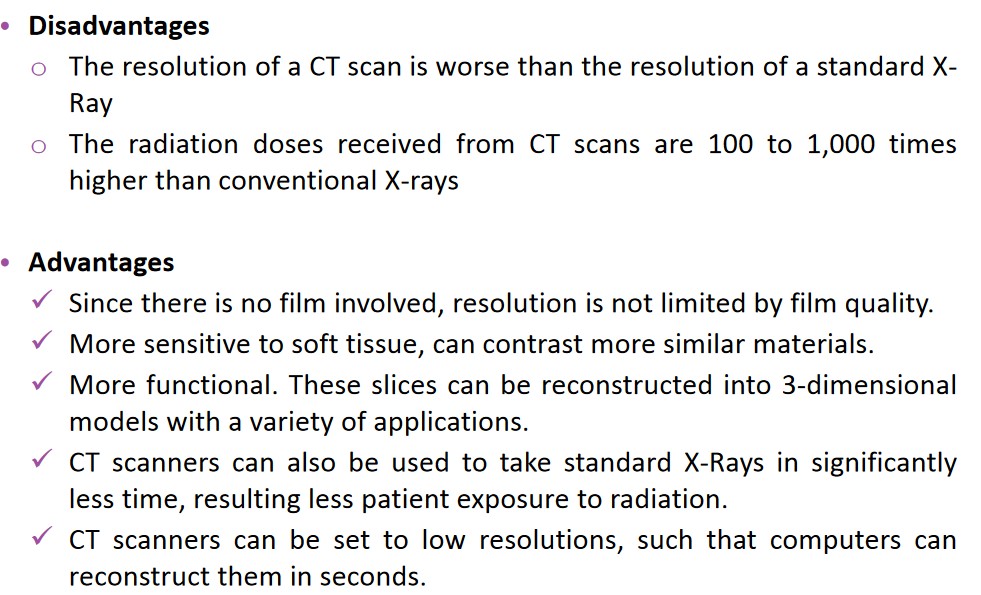
Figure 11.26: Disadvantages and Advantages of CT Scans
The above graphic lists some disadvantages and advantages of using CT scans in a medical setting.